Positron emission tomography detection of human endothelial cell and fibroblast monolayers: effect of pretreament and cell density on 18FDG uptake
Vascular Cell. 2012;
Received: 11 January 2012 | Accepted: 20 March 2012 | Published: 20 March 2012
Vascular Cell ISSN: 2045-824X
Abstract
Background
The non-destructive assessment and characterization of tridimensional (3D) cell and tissue constructs in bioreactors represents a challenge in tissue engineering. Medical imaging modalities, which can provide information on the structure and function of internal organs and tissues in living organisms, have the potential of allowing repetitive monitoring of these 3D cultures
Methods
In this study, human umbilical vein endothelial cells (HUVEC) and human fibroblasts were cultured at different densities and PET was used to non-destructively monitor their glycolytic activity by measuring 18F-fluorodeoxyglucose (18FDG) uptake. Various cell preconditioning protocols were investigated by adjusting the following parameters to optimize 18FDG uptake: glucose starvation, insulin stimulation, glucose concentration, 18FDG incubation time, cell density and radiotracer efflux prevention.
Results
The conditions yielding optimal 18FDG uptake, and hence best detection sensitivity by PET, were as follows: 2-hour cell preconditioning by glucose deprivation with 1-hour insulin stimulation, followed by 1-hour 18FDG incubation and 15-minute stabilization in standard culture medium, prior to rinsing and PET scanning.
Conclusions
A step-wise dependence of 18FDG uptake on glucose concentration was found, but a linear correlation between PET signal and cell density was observed. Detection thresholds of 36 ± 7 and 21 ± 4 cells were estimated for endothelial cells and fibroblasts, respectively.
Keywords
FDG Positron Emission Tomography (PET) HUVEC Endothelial Cells Fibroblasts Tissue EngineeringIntroduction
The growth of tissue substitutes is a dynamic process, requiring close monitoring of cell viability and function over time. Unfortunately, most of the commonly available cell assays (e.g., histology, immunofluorescence or immunocytochemistry) are time consuming and require sacrificing the culture. Although these techniques provide important information on cell phenotype and function, they are often only representatives of specific time points and selected samples within the culture. It remains difficult to trace the evolution of the cell or tissue cultures over time. Our inability to obtain continuous direct information on culture conditions and cells state in thick (few mm to cm range) 3D culture chambers represents a major weakness in understanding bioreactors performance. The main challenge nowadays is to find suitable real-time, non-invasive and, most importantly, non-destructive characterization methods to monitor these large non-transparent cell and tissue cultures. As reviewed by Dubois et al. [1], imaging techniques borrowed and adapted from the biomedical field can be used to monitor the dynamic tissue growth process without interference. While imaging modalities such as X-ray computed tomography (CT) and magnetic resonance imaging (MRI) can provide subtle morphological details, functional imaging using picomolar amounts of radiolabeled molecules can be used to obtain sensitive information on the underlying biological and biochemical processes non-destructively. Positron Emission Tomography (PET), in particular, offers great potential to monitor cell metabolism, proliferation, angiogenesis, perfusion, hypoxia or apoptosis using a range of specific radiotracers without hindering normal tissue development. [18F]-fluorodeoxyglucose (18FDG), a glucose analog labeled with the positron-emitting radioisotope fluorine-18 that can be used as a cell glycolysis marker, is the most commonly used PET tracer. 18FDG uptake can provide valuable information on cell viability, proliferation and initial tissue perfusion in bioreactors [2–4]. In humans, vascular 18FDG uptake is usually undetectable except in some cases of vasculitis or atherosclerosis [5]. Knowing the importance of microvasculature in tissue engineering, we focussed our efforts on increasing 18FDG uptake by fibroblasts and endothelial cells [6]. To improve the PET signal from the target tissue, a proper imaging protocol had to be devised and the uptake parameters of the radiotracer by cells in the culture optimized. As the tissue culture in bioreactors is dependent on several environmental parameters, a screening method to assess the best radiotracer uptake conditions for cell types of interest was first developed.
This study describes a fast
Materials and methods
Human umbilical vein endothelial cells (HUVEC, C-12203) and human dermal fibroblasts (C-12350) were purchased from PromoCell (Heidelberg, Germany). Fetal bovine serum (FBS, F-1051), Medium 199 (M199, M5017), endothelial cell growth supplement (ECGS, E2759), heparin (H1027), gelatin type B (G9391) and Hoechst 33342 (14533) were all obtained from Sigma-Aldrich (Oakville, ON, Canada). Phosphate Buffered Saline (BP665-1), and disposable plastic wares came from Fisher Scientific (Whitby, ON, Canada). Trypsin-EDTA (25200-056) and antibiotics (penicillin G/streptomycin sulphate (15140-122)) were obtained from Invitrogen (Burlington, ON, Canada). 5% dextrose water solution (JB0062) came from Baxter (Mississauga, ON, Canada), glucose-free DMEM (319-061-CL) from Wisent (St-Bruno, QC, Canada) and human Novolin Toronto insulin (DIN 02024233) from Novo Nordisk (Mississauga, ON, Canada). Nunc's Lab-Tek II 8 chamber slides (62407-296) were purchased from VWR (Mississauga, ON, Canada).
Cell culture
HUVEC and fibroblasts were cultured in M199 supplemented with 10% FBS, heparin (90 μg/mL), L-glutamine (2 mM), penicillin G (50 U/mL) and streptomycin sulphate (50 μg/mL). ECGS (20 μg/mL) was added to HUVEC culture media. Cells were kept in an incubator (5% CO2 in humid atmosphere). HUVEC at passage 3 or 4 were used to avoid senescence [7]. Cell seeding was always performed on surfaces coated with gelatin (gelatin solution concentration of 100 μg/mL) to promote cell adhesion and limit batch-to-batch variation towards cell attachment.
Radiochemistry
Fluorine-18 was prepared by the 18O(p, n)18F reaction on 18O enriched water as target material using a TR-19 cyclotron (Advanced Cyclotron Systems, Vancouver, BC, Canada). For the synthesis of [18F]fluorodeoxyglucose (18FDG), an established procedure was used [8].
Step 1 - Factorial design to identify variables affecting 18FDG uptake by cells
To optimize cell signals for PET detection, a factorial design was employed to study the effects of variables among 18FDG incubation time, cell density, insulin exposure and concentration, glucose concentration and culture stabilization time on 18FDG uptake by cell monolayers. A non-replicated one block 2 k-2 factorial design with 3 center points was used for the 18FDG cell uptake experiments. This method in conjunction with ANOVA is well adapted for the identification of the conditions having the most impact on cell uptake of 18FDG. Upper and lower thresholds were defined for each variable investigated in this study, based on our personal experience and the limitations imposed by 18FDG half-life. The variables studied and their corresponding thresholds are presented in Table 1 and parameters were classified in order of influence. The selected limits combined with the factorial design of experiments including center points and 2 rinsing controls yielded a total of 16 experiments. Design of experiments and statistical analyses of the results were done using the Stat-Ease software (Stat-Ease Inc., Minneapolis, MN), using ANOVA. A
Table 1
Thresholds of the experimental design for all cell types in order of influence
| Variables | Lower threshold | Upper threshold | 18FDG uptake gain | |
|---|---|---|---|---|
| Starvation time | 0 h | 3 h | 43.9% | < 0.0001* |
| Cell density | 10 000 cells/mL | 50 000 cells/mL | 20.3% | 0.0002* |
| 18FDG incubation time | 1 h | 2 h | 5.8% | 0.0062* |
| Insulin concentration | 0.0 nmol/mL | 6.0 nmol/mL | 1.4% | 0.1016 |
| Insulin incubation time | 0 h | 1 h | 1.0% | 0.1475 |
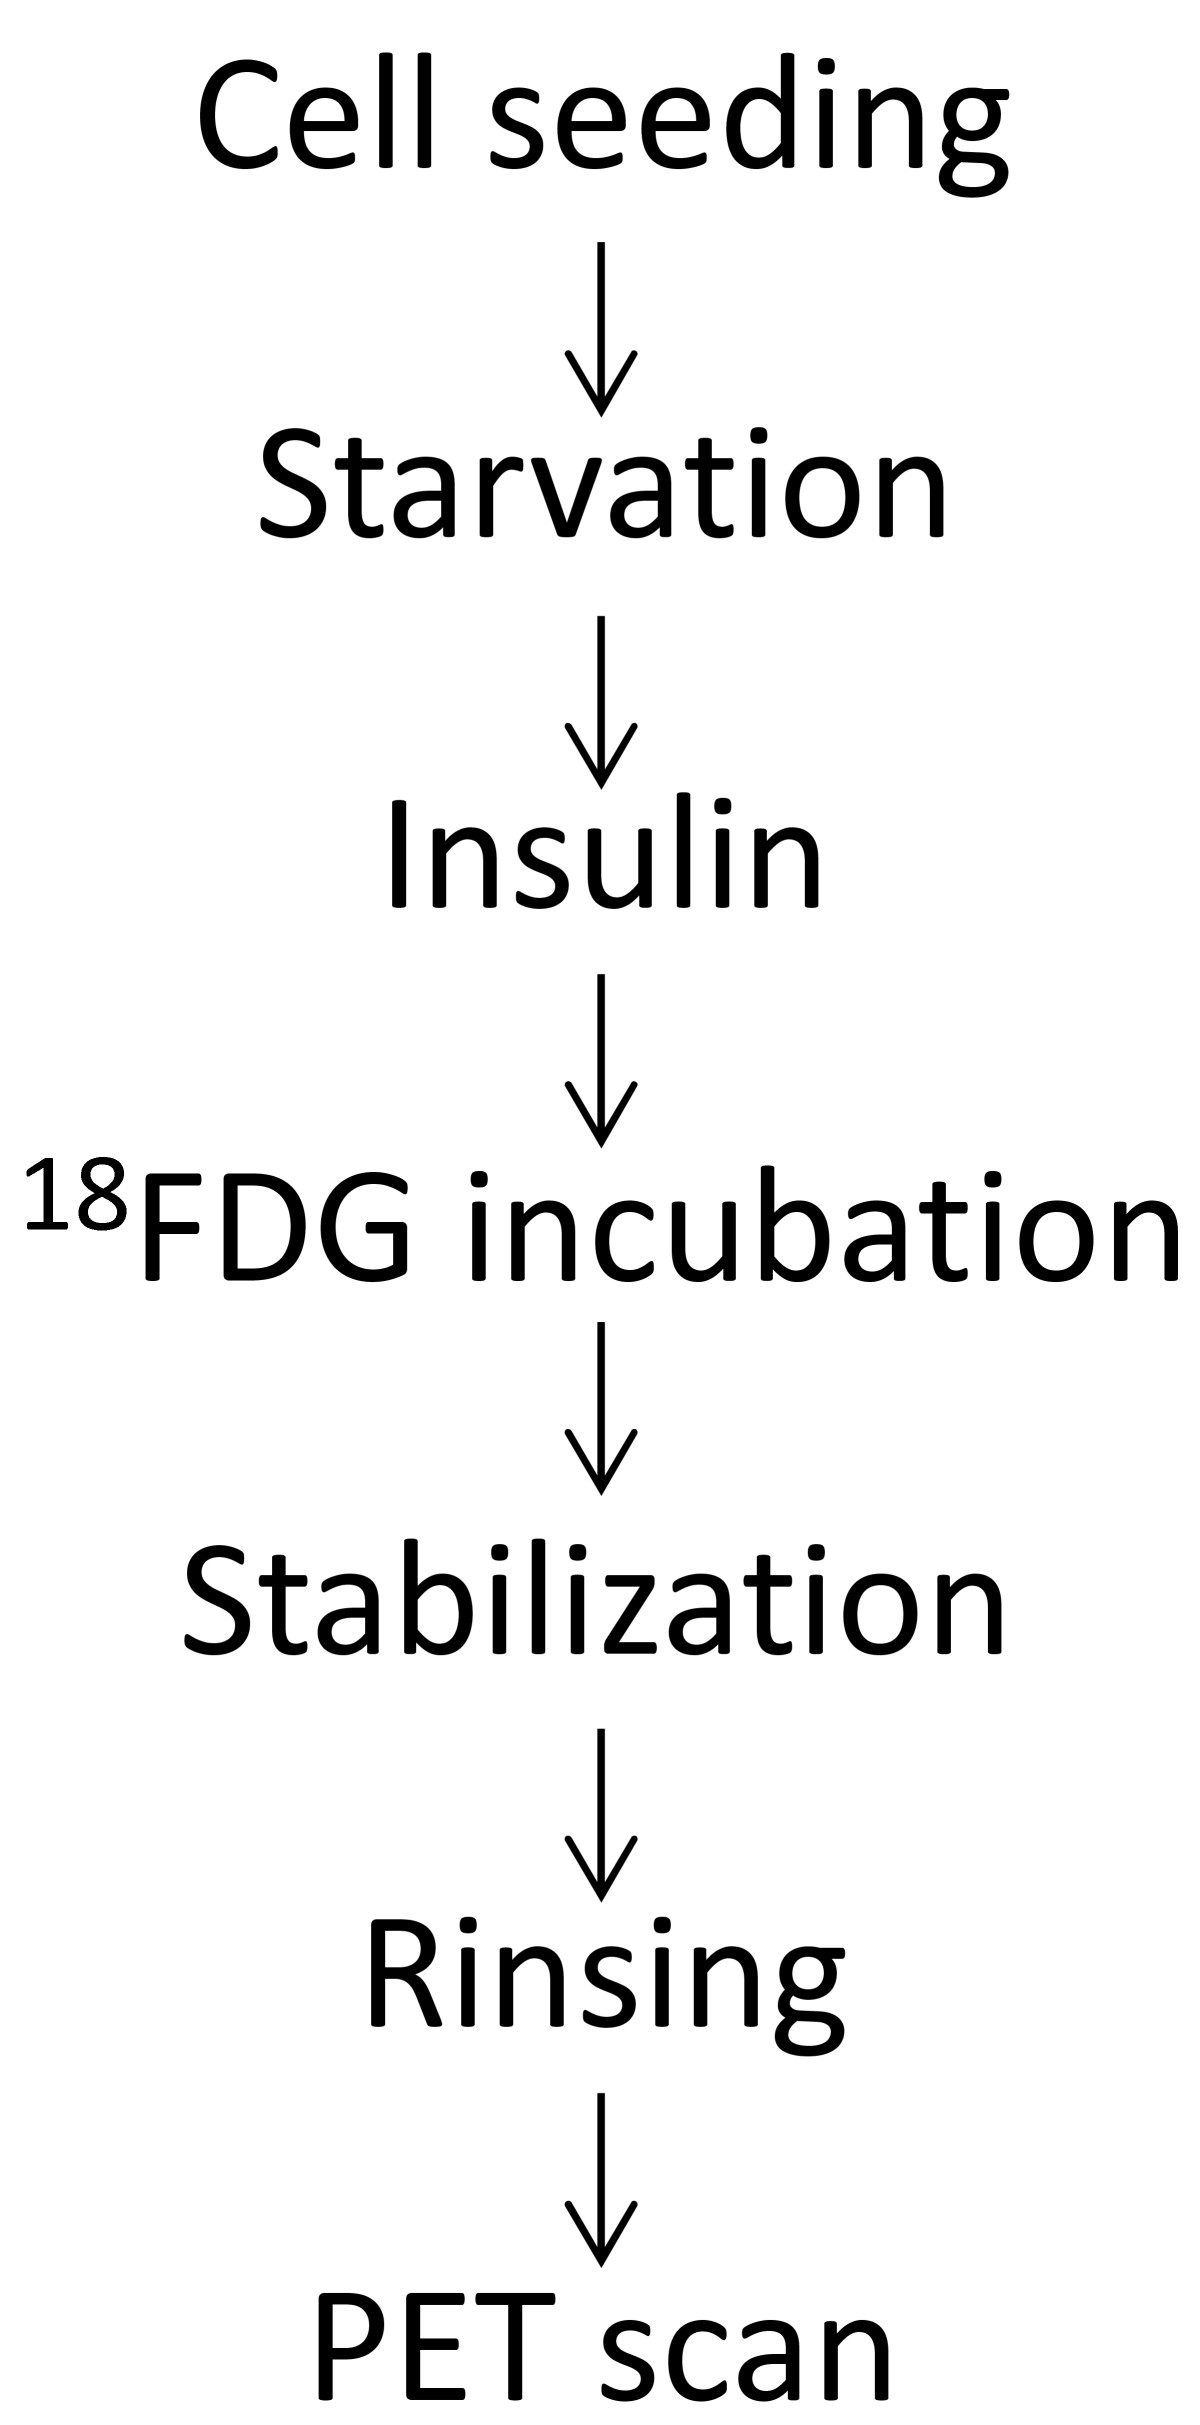
Figure 1
Figure 1 caption
Experimental timeline for the factorial design.
Step 2 - Cell preconditioning to increase 18FDG uptake
In light of the factorial design results, a new experimental design and timelime was determined. The new protocol is summarized in Figure 2. The starvation period was shortened to 2 hours and the 1-hour 18FDG incubation was preferred since the gain for the extra hour was not deemed sufficient considering the loss caused by the 109.8 minutes half-life of the 18 F radiotracer. The used insulin concentration was also lowered down to a physiological level. The most important parameter affecting cell 18FDG uptake (glucose starvation) was further investigated to find which optimal glucose concentration should be used without affecting the samples. Once found, the influence of cell density on the measured signal was tested.
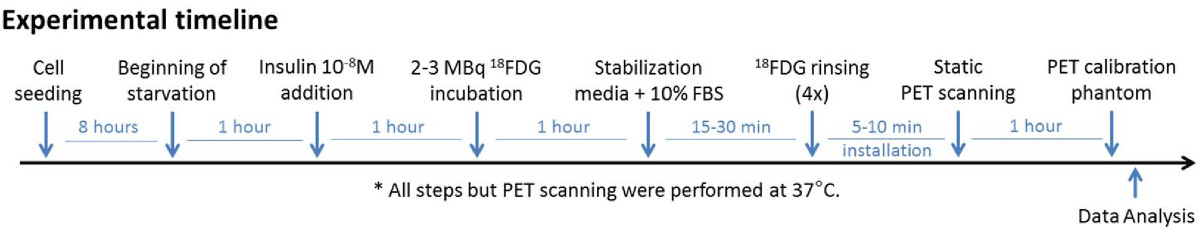
Figure 2
Figure 2 caption
Experimental timeline for step 2.
Cell culture imaging
Positron emission tomography (PET) imaging was used to monitor the cell 18FDG uptake together with X-ray computed tomography (CT) imaging to define the morphology of the chamber slides. A Triumph™ PET/CT dual modality imaging platform (Gamma Medica, Inc., Northridge, CA, USA) was used, which consisted of a LabPET™ avalanche photodiode-based digital PET scanner with a 7.5 cm axial field-of-view [10] capable of achieving a transaxial spatial resolution of 1.2 mm and a detection efficiency of 2.1% with an energy window setting of 250-650 keV.
Chamber slides were mounted in stacks (Figure 3B) and centered in the scanner transaxial and axial field of view (FOV) (Figure 3C). One-hour static PET data acquisitions with axial double sampling motion to improve resolution were performed for every cell imaging session, followed by 5-minute static imaging of a phantom containing a known amount of 18FDG at the end of the imaging period to allow for the conversion of detected events (in CPS/Pixel) into MBq of retained activity in cells. The calibration phantom consisted of cell-free chamber slides with two known 18FDG concentrations in volumes of 200 μL pipetted in non-consecutive chambers. The scanner efficiency was further normalized within a day of the measurement with a 68Ge 18.5 MBq rotating line source (PET-78/0.5, Sanders Medical, Knoxville, TN) for at least 4.5 hours to ensure reproducibility between measurements, which were taken up to several weeks apart. PET images were reconstructed on a 0.25 mm × 0.25 mm × 1.1175 mm grid using 20 iterations of a 2D maximum-likelihood expectation maximization (MLEM) algorithm implementing position-dependent detector response [11]. Corrections for individual detector efficiency and random coincidences were applied, but attenuation and scatter corrections were omitted since they were unnecessary given that all measurements were taken with the same stacked thin chamber slides geometry. CT acquisition was performed in fly mode with 512 projections in 2.13 min at 60 KVP and 220 μA. The single frame was reconstructed in 0.17 × 0.17 × 0.17 mm3 voxels. The Amide freeware (sourceforge.net version 0.9.2) was used to analyze the radiotracer concentration in the reconstructed images, using the CT scan image of the culture slide to draw 8 equal regions of interest (ROI) over each chamber (Figure 3D). These ROI were then projected on the corresponding PET images for data analysis (Figure 3E).
Results
Factorial design
The results of the factorial design experiments are summarized in Table 1. Design showed that all, but insulin concentration and incubation time had a
Different stabilization periods were evaluated to facilitate cell 18FDG trapping and avoid efflux. These processes are dependent on cell hexokinase activity [12], the rate-determining step for metabolic trapping [13, 14] and 18FDG-6-phosphate dephosphorylation by glucose 6-phosphatase [15, 16]. Indeed, hexokinase had been shown to reach a maximum activity starting at 5 mM of glucose and over [17]. To maximise 18FDG confining and minimise efflux, once the radiotracer incubation time was elapsed, we added 5.5 mM glucose containing 10% FBS to each well for periods of 0, 15, 30 or 45 minutes before rinsing. We found that a stabilization time between 15 to 30 minutes gave a stable signal and this period was considered optimal for both cell types.
Effect of glucose starvation on cell morphology
When using PBS as a glucose-free buffer at 37°C, all cells, especially HUVEC, became spherical and detached from the surface, which is consistent with previous observations [18]. A treatment that changes samples morphology would not be appropriate for bioreactor cultures. This problem was solved using glucose-free DMEM instead. Fibroblasts did not undergo morphological changes under any conditions with this starvation medium (
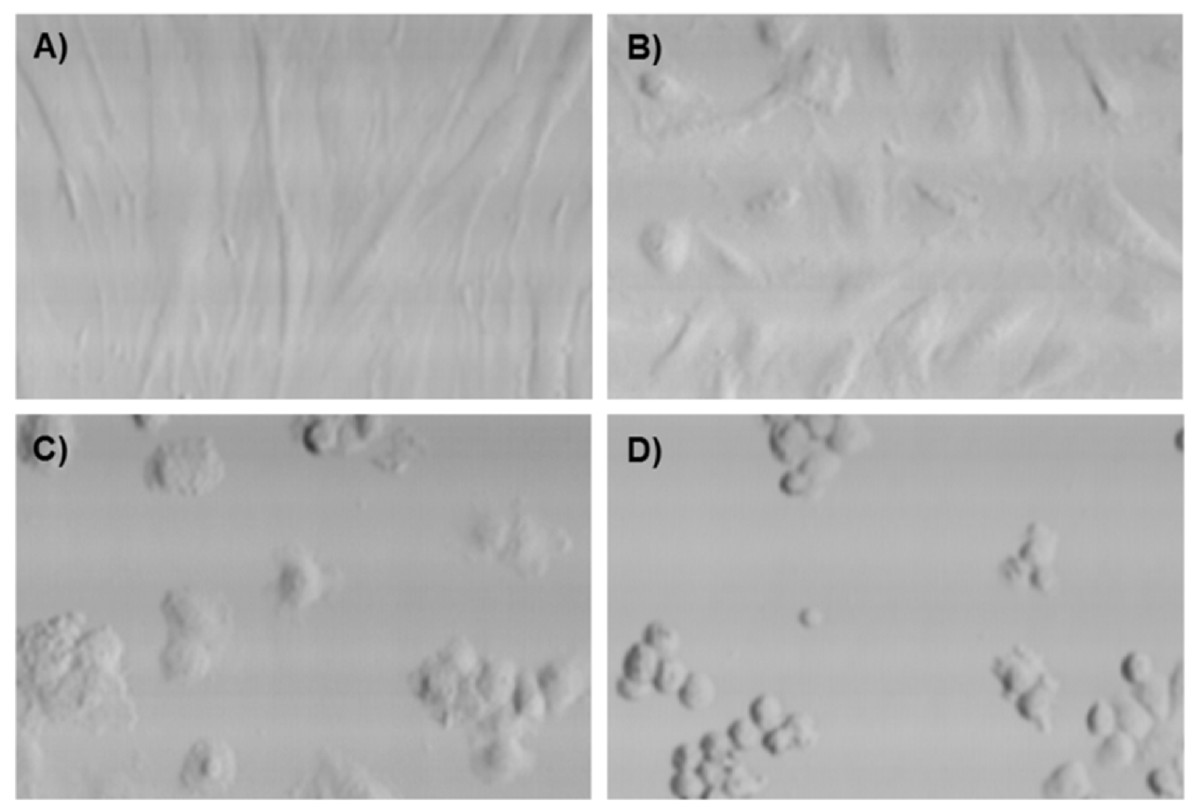
Figure 4
Figure 4 caption
Laser scanning cytometry images of fibroblasts (A) and HUVEC incubated 2 hours in DMEM containing 2, 0.5 and 0 mM glucose (B to D respectively). A is representative of all fibroblast samples. B is representative of all glucose concentrations above 2 mM.
Effect of glucose starvation on 18FDG uptake
HUVEC and fibroblast monolayers were each treated with media containing different glucose concentrations and subsequently scanned by PET to assess their 18 FDG uptake, as shown in Figure 5a, b, and 5c. A plateau was observed in scans of fibroblasts between 2.5 and 4.0 mM of glucose (Figure 5d), so further investigation were carried out in that range to confirm these observations. Quantitative PET data obtained by ROI analysis, after correction for radioactive decay, are reported in Figure 6A. For fibroblast monolayers, 18FDG signal decreases steeply in a linear fashion (R2 = 0.9972) from 0.5 to 2 mM of glucose, then slightly rebounds to a plateau between 2.5 and 4 mM, to fall again most probably because the glucose concentration exceeded cell needs and entered in competition with 18FDG. For HUVEC, excluding the result for 0.5 mM glucose treatment that deeply affected cell morphology (Figure 6A, star), the 18FDG signal drops steeply between 1.0 and 1.5 mM, then levels off between 1.5 and 3 mM, before steadily decreasing for higher glucose concentrations.
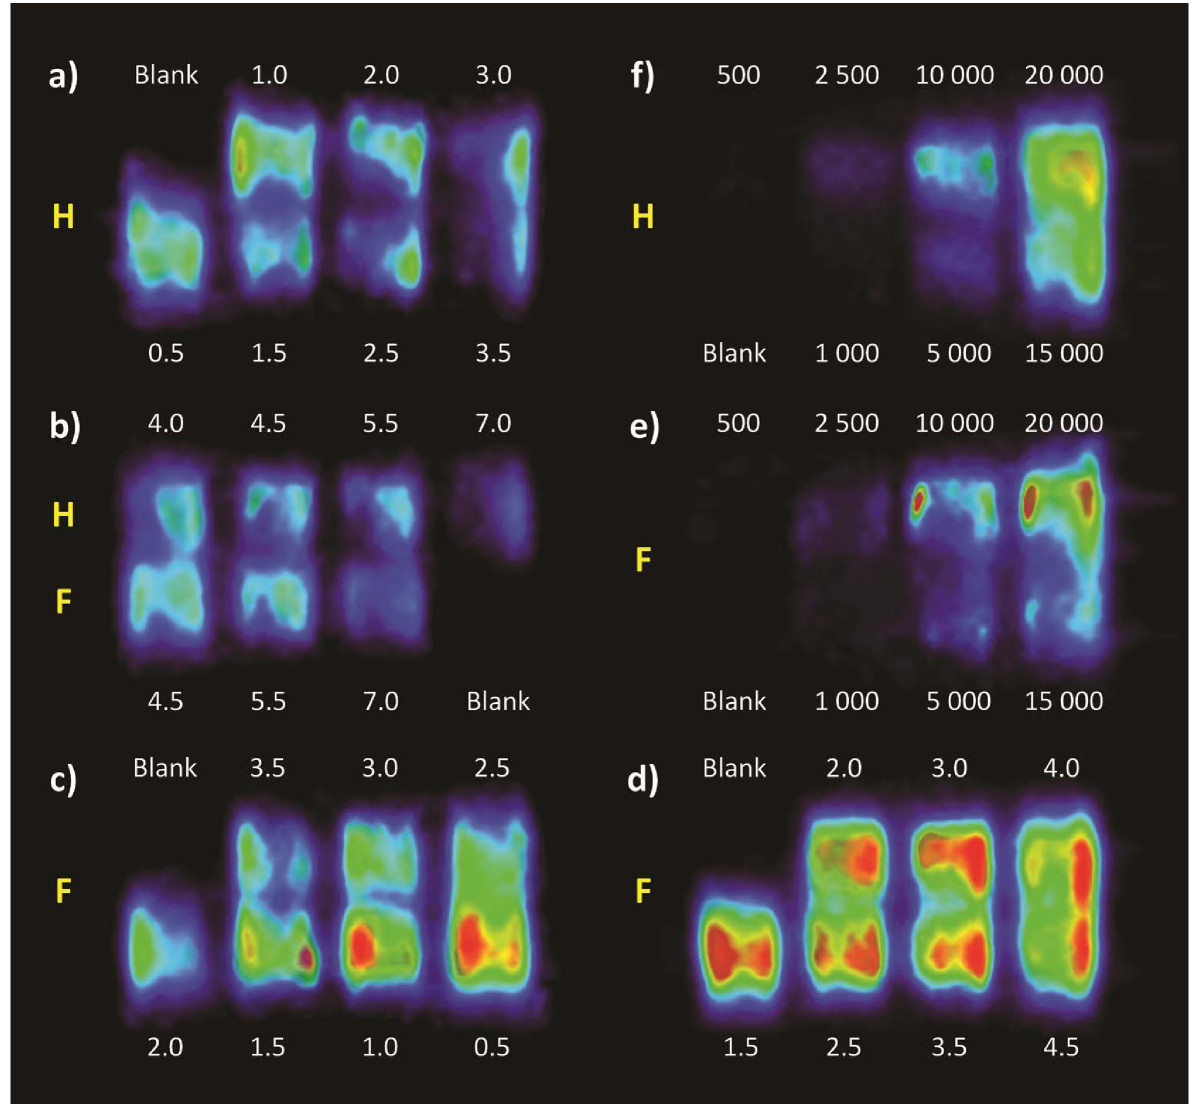
Figure 5
Figure 5 caption
FDG/PET images of HUVEC (H) and fibroblasts (F) pretreated with media containing glucose concentrations from 0.5 to 7.0 mM (a to c). Panel (d) shows a closer look at the plateau found with fibroblasts between glucose concentrations of 1.5 and 4.5 mM. Note that the color scale has been stretched in (d) to better appreciate the subtle differences between relatively similar samples. Numbers above and below the PET images represent the media glucose concentration in mM. Panels and show PET images of fibroblast and HUVEC monolayers at different cell densities treated with 3 mM glucose. Numbers above and below these images indicate the numbers of cells at seeding (8 hours prior to scanning).
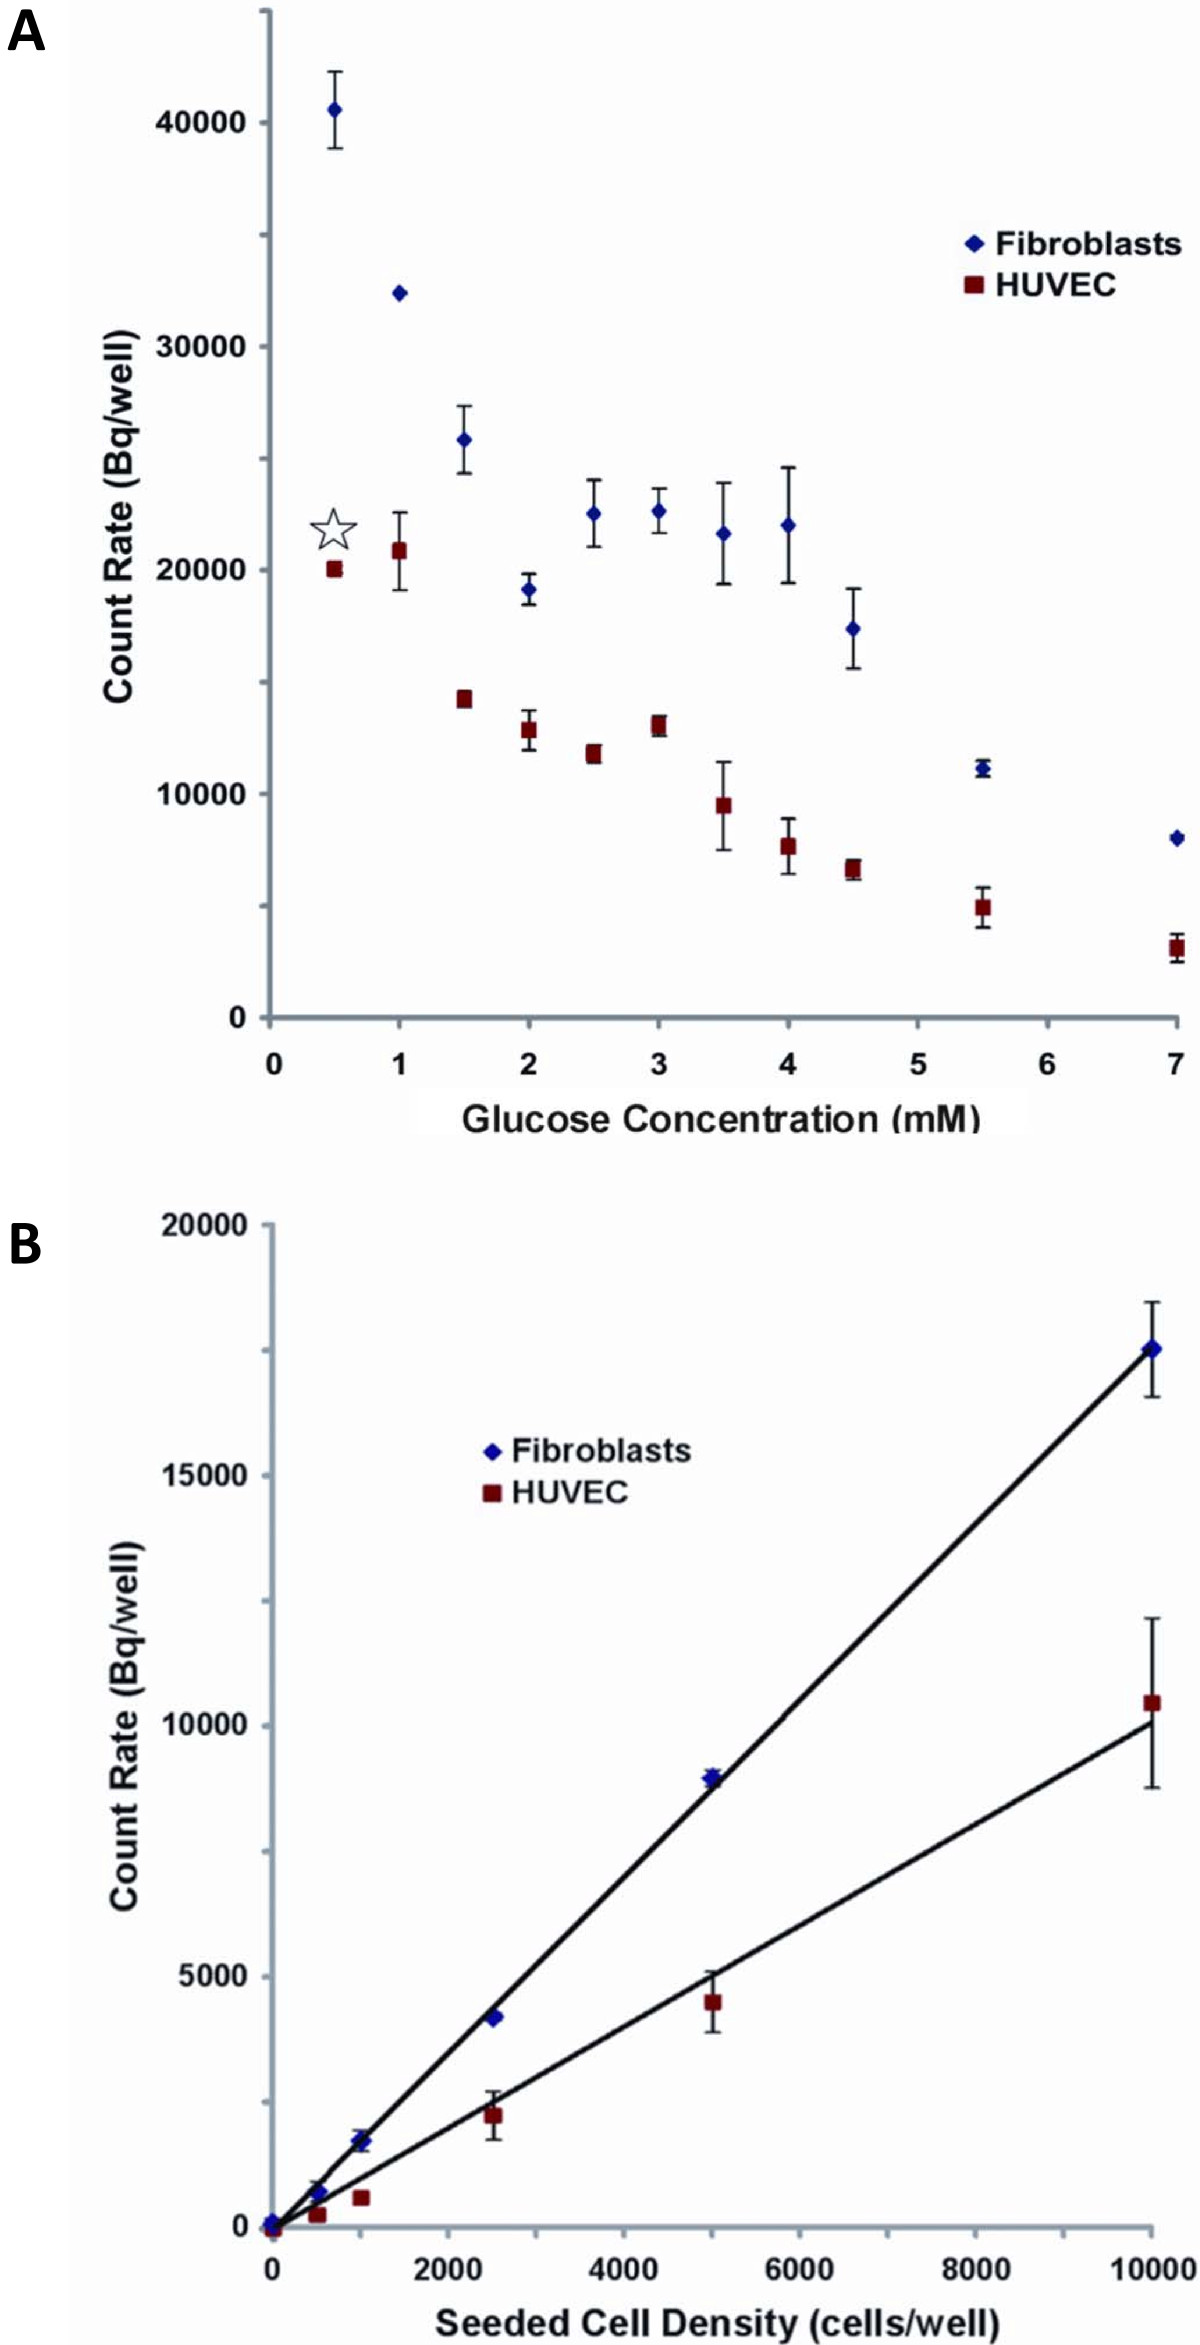
Figure 6
Figure 6 caption
Quantitative PET data analysis (≥ 3) as a function of glucose concentration during the 2-hour starvation (A) and cell density at seeding (B). The star in (A) indicates that cell morphology was deeply affected (see Figure 4C).
Effect of cell density on PET signal
A linear correlation was found between 18FDG signal and the number of cells. Assuming that a signal-to-noise ratio equal or larger than 3 is significant, detection thresholds of 36 ± 7 cells for HUVEC and 21 ± 4 cells for fibroblasts were extrapolated from the linear correlations used to fit data in Figure 6B. The difference of slope between HUVEC and fibroblasts in this experiment reflects the higher 18FDG uptake by the latter, in agreement with results obtained in Figure 6A.
Discussion
Glucose deprivation is known to gradually increase total cellular transporter proteins [19, 20] and is also associated with decreased protein turnover in mammalian fibroblasts [19]. Starved mammalian cells under low glucose concentration conditions undergo a p53 dependent G1 phase arrest that is quickly reversible upon glucose restoration [21]. Fibroblasts have been showed to have a 24-hour survival capacity starting from 0.1 mM of glucose [21], which is in agreement with our results. Highest 18FDG uptakes were always obtained under a 2 mM glucose concentration, but such a low glucose concentration affected HUVEC morphology (Figure 4C-D). The spheroid HUVEC appearance observed under 1.5 mM glucose concentration can be due to cell-cell detachment caused by F-actin conversion in G-actin rather than being a consequence of cell death induction [22]. However, not every preconditioning treatment susceptible to influence cell morphology can be considered for imaging cell or tissue substitutes.
When working with HUVEC, the optimal 18FDG uptake, while still maintaining cell integrity, was achieved using 3 mM glucose containing DMEM. The 3 mM glucose concentration also corresponded to the uptake plateau for fibroblasts. Hence, this glucose concentration was used for the cell density gradient experiments shown in Figure 5e and 5f and analysed in Figure 6B. Nearly all cell culture media contain a glucose concentration of at least 5.5 mM, which can be considered as a tremendous source of carbohydrate able to last for days [23]. Most cells do not need that much glucose and quickly become saturated, making them produce and excrete lactate [23]. Lowering the glucose level to 3 mM for 2 hours increased 18FDG uptake to approximately twice that found when using 5.5 mM media for both HUVEC and fibroblasts. Endothelial cells were shown to present different glucose metabolism and insulin responsiveness according to their organ of origin, so caution should be exercised when applying these results to other cell types [24].
The FBS supplemented M199 medium used for the cell culture contained 4 mM glucose, but since it was used at a concentration of 1% in the cell starvation media, this amount of added glucose was considered as non significant. Hiraki et al. [25] reported that glucose transport is also regulated by calf serum growth factors in a concentration-dependent manner. Considering that serum induced a first rise of sugar uptake within 10 minutes and a second at approximately 1 hour due to the activation of glucose transporter gene expression [25], it might be possible to gain extra signal by using 15% FBS containing DMEM before adjusting the glucose level to 3 mM.
Over-expression of insulin-receptors in HUVEC showed the presence of a functional insulin pathway [26]. A small increase in 18FDG signal had been noticed in our data when using 10-8 M insulin, but this effect turned out not to be statistically significant. Insulin action might not be a major actor in our system, but anything that could bring some improvement is always welcome, so a 10-8 M physiological concentration was preserved in our protocol, as suggested by the maximum insulin effect observed by Gerritsen et al. [13, 27]. It must also be kept in mind for further studies that tissues such as heart, skeletal muscles and adipose tissues do present the insulin responsive glucose transporter GLUT4 [28–30], so even if our results with fibroblasts (known to have GLUT1, 3 and 4 [31]) turned out not to be significant, we strongly suggest that the insulin parameter always be tested.
Now that a protocol to maximize 18FDG cell uptake has been established, further studies are being planned to investigate additional parameters that are known to influence glucose uptake in cells, such as the presence of nitric oxide [12, 24, 26], growth factors [32], hypoxia [33], and proliferation.
More imaging studies will be needed to fully understand the importance of these factors in high cell density cultures, and PET imaging offers considerable potential to achieve this goal. Numerous key parameters must be dynamically monitored in real time in tissue cultures to optimize their development, which include morphology, viability, proliferation, metabolism, angiogenesis, perfusion, nutrient and oxygen consumption, hypoxia, apoptosis, and sometimes secretion of specific proteins. So far, only 18FDG, a cell glycolytic activity marker, has been investigated, but several other PET tracers are available, such as 18F - fluorothymidine (18FLT) and 11 C-methionine to, respectively, monitor DNA and protein synthesis, 18 F-fluoromisonidazole (18 F-MISO) for imaging hypoxia [34], and 18F- or 64Cu-labeled annexin-V for measurement of apoptosis [35, 36]. It would also be possible to adapt the proposed protocol for non-adherent (floating) cells by using microtubes for imaging instead of the square culture chambers. A centrifugation step would then be required prior to media removal for rinsing. Since radiotracers can sometimes bind to the microtube's wall, it may be advisable to transfer the suspension in a fresh tube after every rinse to avoid contamination from the container in the PET images.
Extension of the protocol used in this study to other cell types would be straightforward, provided that they have a similar growth rate and 18FDG delivery times. Due to the 109.8 minutes half-life of fluorine-18, the used experimental set-up with 18FDG could hardly be feasible under longer working conditions than the 12-h protocol used here. Obviously, other biological parameters could be monitored over extended observation periods with possibly longer incubation times using molecular probes labelled with longer half-life radiotracers, such as 64Cu (12.8 h), 89Zr (78 h) or 124I (4.18 d).
Conclusions
In this study, we have investigated the 18FDG uptake of two human cell types of importance in many tissue engineering applications. Parameters influencing 18FDG uptake by HUVEC and human fibroblasts have been optimized by directly imaging living cell monolayers with PET using a fast screening
Acknowledgements
This study was supported by the
Authors’ original submitted files for images
Below are the links to the authors’ original submitted files for images.
Authors’ original file for figure 1
Authors’ original file for figure 2
Authors’ original file for figure 3
Authors’ original file for figure 4
Authors’ original file for figure 5
Authors’ original file for figure 6
Authors’ original file for figure 7
References
- Bioreactors for Tissue Engineering: Design, Application, and Monitoring. Comprehensive Biotechnology. 2011.:383-399.
- Engineering of a vascularized scaffold for artificial tissue and organ generation. Biomaterials. 2005;26:6610-6617.
- Design and performance of a bioreactor system for mechanically promoted three-dimensional tissue engineering. Br J Oral Maxillofac Surg. 2006;44:134-140.
- Imaging glucose metabolism in perfluorocarbon-perfused hepatocyte bioreactors using positron emission tomography. J Artif Organs. 2009;12:247-257.
- Imaging of large vessel vasculitis with 18FDG PET: illusion or reality? A critical review of the literature data. Eur J Nucl Med Mol Imaging. 2003;30:1305-1313.
- The effects of co-culture with fibroblasts and angiogenic growth factors on microvascular maturation and multi-cellular lumen formation in HUVEC-oriented polymer fibre constructs. Biomaterials. 2010;31:5091-5099.
- A new model of human aortic endothelial cells in vitro. Biochimie. 2000;82:1107-1114.
- Efficient stereospecific synthesis of no-carrier added 2-[18 F]-fluoro-2-deoxy-D-glucose using aminopolyether supported nucleophilic substitution. J Nucl Med. 1986;27:235-238.
- In vitro and in vivo potency of insulin analogues designed for clinical use. Diabet Med. 1991;8:839-847.
- Performance evaluation of the LabPET APD-based digital PET scanner. IEEE Trans Nucl Sci. 2009;56:10-.
- Detector response models for statistical iterative image reconstruction in high resolution PET. IEEE Trans Nucl Sci. 2000;47:1167-.
- Nitric oxide stimulates 18 F-FDG uptake in human endothelial cells through increased hexokinase activity and GLUT1 expression. J Nucl Med. 2005;46:365-370.
- Glucose starvation is required for insulin stimulation of glucose uptake and metabolism in cultured microvascular endothelial cells. Microvasc Res. 1988;35:153-166.
- Glut-1 and hexokinase expression: relationship with 2-fluoro-2-deoxy-D-glucose uptake in A431 and T47D cells in culture. Cancer Res. 1999;59:4709-4714.
- Hexokinase binding to mitochondria: a basis for proliferative energy metabolism. J Bioenerg Biomembr. 1997;29:331-338.
- Tissue-specific differences in 2-fluoro-2-deoxyglucose metabolism beyond FDG-6-P: a 19 F NMR spectroscopy study in the rat. NMR Biomed. 2003;16:494-502.
- High glucose concentrations partially release hexokinase from inhibition by glucose 6-phosphate. Proc Natl Acad Sci USA. 1985;82:1552-1554.
- Characterization of 18 F-FDG uptake in human endothelial cells in vitro. J Nucl Med. 2004;45:455-460.
- Glucose deprivation and hexose transporter polypeptides of murine fibroblasts. J Biol Chem. 1986;261:6778-6789.
- Facilitative glucose transporters. Eur J Biochem. 1994;219:713-725.
- AMP-activated protein kinase induces a p53-dependent metabolic checkpoint. Mol Cell. 2005;18:283-293.
- Induction of cell-cell detachment during glucose starvation through F-actin conversion by SNARK, the fourth member of the AMP-activated protein kinase catalytic subunit family. Biochem Biophys Res Commun. 2003;311:156-161.
- Reversible independent alterations in glucose transport and metabolism in cultured human cells deprived of glucose. J Cell Physiol. 1976;89:143-155.
- Regulation of amino acid and glucose transporters in endothelial and smooth muscle cells. Physiol Rev. 2003;83:183-252.
- Growth factors rapidly induce expression of the glucose transporter gene. J Biol Chem. 1988;263:13655-13662.
- Roles for insulin receptor, PI3-kinase, and Akt in insulin-signaling pathways related to production of nitric oxide in human vascular endothelial cells. Circulation. 2000;101:1539-1545.
- Insulin binding and effects of insulin on glucose uptake and metabolism in cultured rabbit coronary microvessel endothelium. Proc Soc Exp Biol Med. 1985;180:17-23.
- Immunogold labeling study of the distribution of GLUT-1 and GLUT-4 in cardiac tissue following stimulation by insulin or ischemia. Am J Physiol Heart Circ Physiol. 2007;292:H2009-H2019.
- The GLUT4 code. Mol Endocrinol. 2008;22:226-233.
- Turning signals on and off: GLUT4 traffic in the insulin-signaling highway. Physiology (Bethesda). 2005;20:271-284.
- Human fibroblasts express the insulin-responsive glucose transporter (GLUT4). Trans Assoc Am Physicians. 1990;103:202-213.
- Enhancement of glucose transport by vascular endothelial growth factor in retinal endothelial cells. Invest Ophthalmol Vis Sci. 2000;41:1876-1884.
- Experimental hypoxia is a potent stimulus for radiotracer uptake in vitro: comparison of different tumor cells and primary endothelial cells. Cancer Lett. 2007;254:102-110.
- On measuring hypoxia in individual tumors with radiolabeled agents. J Nucl Med. 2001;42:1653-1655.
- PET imaging of apoptosis with 64Cu-labeled streptavidin following pretargeting of phosphatidylserine with biotinylated annexin-V. Eur J Nucl Med Mol Imaging. 2007;34:247-258.
- Evaluation of 18 F-annexin V as a PET imaging agent in an animal model of apoptosis. J Nucl Med. 2005;46:658-666.

The present article has been published in Vascular Cell journal by Publiverse Online S.R.L.