The angiogenic gene profile of circulating endothelial progenitor cells from ischemic stroke patients
Vascular Cell. 2013;
Received: 2 October 2012 | Accepted: 29 January 2013 | Published: 6 February 2013
Vascular Cell ISSN: 2045-824X
Abstract
Background
The identification of circulating endothelial progenitor cells (EPCs) has introduced new possibilities for cell-based treatments for stroke. We tested the angiogenic gene expression of outgrowth endothelial cells (OECs), an EPC subtype capable to shape vessel structures.
Methods
OECs (at colony or mature stages) from ischemic stroke patients (n=8) were characterized using the RT2 ProfilerTM human angiogenesis PCR Array, and human microvascular endothelial cells (hCMEC/D3) were used as an expression reference of endothelial cells.
Results
Colony-OECs showed higher expression of
Conclusion
Our study shows that OECs from stroke patients present higher levels of pro-angiogenic factors at early stages, decreasing in mature OECs when they become more similar to mature microvascular endothelial cells.
Keywords
Ischemic stroke Angiogenesis Endothelial progenitor cells Gene expression VasculogenesisIntroduction
Endothelial progenitor cells (EPCs) is a minor population of circulating mononuclear cells that participates in adult neovascularization in pathological and physiological processes. Current research on EPCs in adults holds great promise and is receiving much attention due to their contribution to neoangiogenesis in vascular injuries, such as wound healing, limb ischemia, myocardial infarction, atherosclerosis or stroke [1].
An approach to isolate EPCs from peripheral blood utilizes
To better understand the molecular program of OECs in ischemic stroke, our aim was to examine the angiogenesis-related gene expression profile of OECs from ischemic stroke patients at initial colony (colony-OECs) or mature stages (mature-OECs), and compared them to mature human cerebral microvascular endothelial cells (hCMEC/D3) as a reference of endothelial cell expression.
Materials and methods
Ethics statement
The study was approved by the Ethics Committee of our institution and conducted in accordance with the Declaration of Helsinki. All patients or relatives and healthy controls gave written informed consent.
Isolation and culture EPCs
Peripheral blood (20 ml) was obtained in EDTA-anticoagulated tubes from patients who had suffered a non-lacunar ischemic stroke (n=8) involving the middle cerebral artery (MCA) territory between 24 h and 7 days after onset of symptoms, and who had been admitted to the emergency department of our center. OECs were isolated from peripheral blood as previously described [4]. Colony-OECs appeared as rounded expanding colonies, while later acquisition of confluent cobblestone-shaped in monolayers was identified as mature-OECs (Figure 1A). hCMEC/D3 cells, which are derived by immortalization of human brain primary microvascular endothelial cells were grown as previously described [5]. Additionally, EPCs from sex- and age-matched control subjects free of ischemic events, inflammatory or infectious diseases (n=17) were initially cultured but cell cultures did not yield OEC cells.
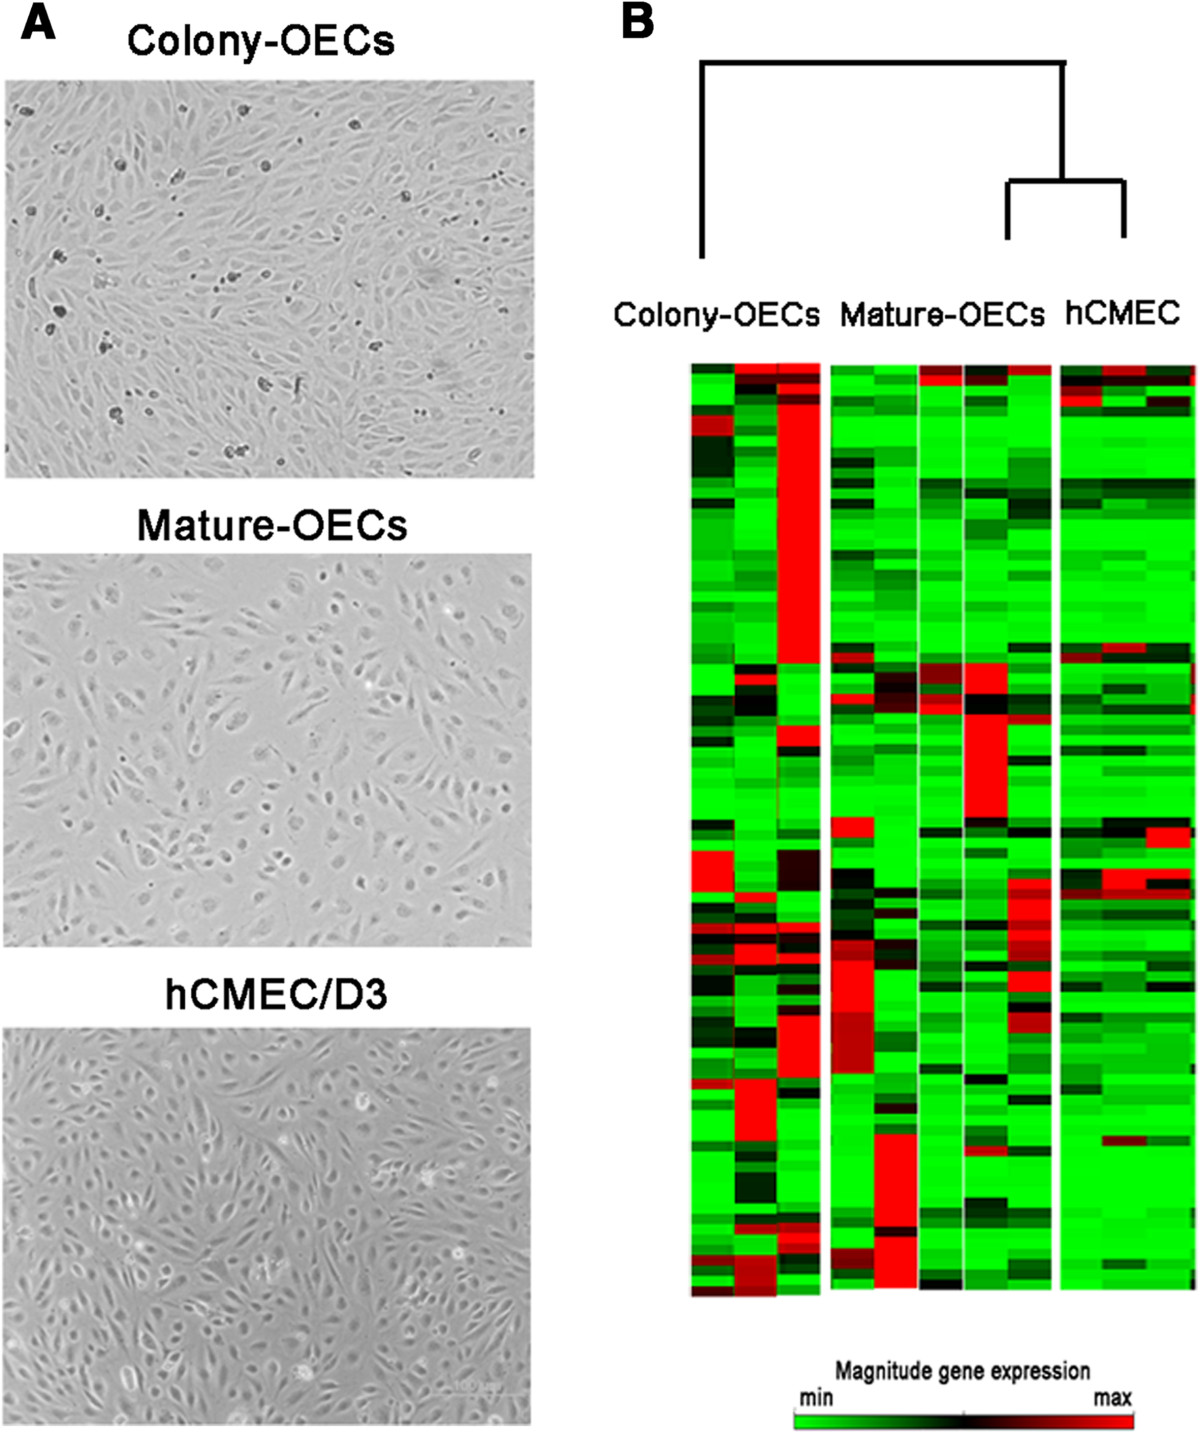
Figure 1
Figure 1 caption
Representative cell culture images and gene expression profile of the studied cells. A) Representative phase contrast images of colony-OECs (40× magnification) and mature-OECs (100x magnification) from ischemic stroke patients and hCMEC/D3 (100× magnification). B) Heat maps illustrating gene-expression profile of patients included in colony-OECs, mature-OECs and hCMEC/D3 groups. The green color indicates low expression and the red color indicates high expression.
A detailed history of any concomitant medication was obtained from each patient and all were scored for stroke severity and neurological status on admission and on follow-up visits according to the National Institutes of Health Stroke Scale (NIHSS). Functional outcome was defined by modified Rankin Scale (mRS) at three months and patients with mRS >2 points were considered functionally dependent.
RNA isolation and quality control
RNA was obtained from cell cultures for both early-colony stage OECs and mature OECs. Since those cells obtained from the colony stage were not further expanded, different patients were included in the mature-OECs group. The RNA from the mature-OECs was isolated from cells between the 4th and 10th passage since after 12 population doublings mature-OECs started to change their morphology probably undergoing to senescence. The colony-OECs were isolated before the first passage was done. Finally, hCMEC/D3 cells line was included as a reference of human endothelial cell type.
Colony-OECs obtained from ischemic stroke patients (n=3) were isolated using a cell scraper. Mature-OECs (1×10⁵ cells/mL) taken between passages 4 and 10 from ischemic stroke patients (n=5) and hCMEC/D3 (1×10⁵ cells/mL) at different passages (from 32 to 34; n=3) were seeded in twelve-well plates with EGM-2 (Clonetics®, CA, USA) and maintained until confluence reached about 90%. A total of 11 samples were included in the study. Total RNA was extracted with the RNeasy Mini kit (Qiagen, CA, USA). The RNA concentration and quality were measured using the Bioanalyzer 2100 system (Agilent, CA, USA). All samples presented high-quality RNA with RNA integrity numbers above 8.5. cDNA was pre-amplified using RT2 Nano PreAmp cDNA Synthesis Primer Mix Human Angiogenesis kits according to manufacturer’s instructions (SabBioscience, Qiagen). RT2 Profiler human angiogenesis PCR array was performed for quantitative PCR in the ABI 7000 system (Applied Biosystems, USA) with the following cycling conditions; 10 min at 95°C, 15 s at 95°C, 1 min 60°C for 40 cycles with a final infinite 4°C hold.
Data normalization
Five endogenous control genes
Real time PCR analysis
Quantitative Real-time PCR (qRT-PCR) was used to measure mRNA expression levels of
Statistical analysis
The statistical significance was set at p value less than 0.05 and a mean difference equal to or greater than 2-fold change in expression levels. Normal distribution of the variables was tested using the Shapiro-Wilk test. Differences between colony-OECs, mature-OECs and hCMEC/D3 groups were determined using the One-Way ANOVA or Kruskal Wallis and Mann Whitney tests for normal and non-normal distributions, respectively. Data were expressed as mean fold change ± SD for normal distributed variables or median (interquartile range) for non-normal distributed variables. All statistical analyses were performed with SPSS version 15.0 software. To account for multiple statistical testing, false discovery rate (FDR)
Results
The stroke patients included in the study were under different secondary prevention treatments. One patient in each study-group was receiving oral anticoagulation therapy, 2 patients in colony-OECs and 3 in mature-OECs group were under antiplatelet agents. In addition, 2 patients in colony-OECs group and 3 in mature-OECs group were under statins. Moreover, a patient in the colony-OECs group showed a previous stroke.
Baseline NIHSS was similar in patients from colony-OECs and mature-OECs groups (14 ± 7.2 vs. 8.2 ± 5.8; p=0.297 respectively) and also NIHSS at discharge (12.3 ± 6.5 vs. 11.6 ± 15.9; p=0.513 respectively). Regarding functional outcome no differences were found between patients from colony-OECs and mature-OECs groups (4 ± 2 vs. 2.4 ± 2.2; p=0.263 respectively). None of the analyzed genes showed any correlation between their expression level and the clinical outcome. White blood cell counts of the stroke patients included in the study were not statistically different (p=0.65).
The Human Angiogenesis RT2 Profiler PCR Array profiles the expression of 84 key genes involved in the biological processes of angiogenesis. Over 90% of the transcripts (n= 75) were detected whereas the expression of
Overall, the analysis of the heat maps showed that mature-OECs gene-expression pattern partially matched hCMEC/D3 (Figure 1B). Our results showed that in the colony-OECs group, 45 genes were overexpressed whereas only 13 genes were underexpressed. Similarly, the mature-OECs group showed 31 genes overexpressed and 15 underexpressed compared to hCMEC/D3 cells. At the same time, we only identified 13 genes displaying a significantly different expression between colony-OECs and mature-OECs and all of them were overexpressed in OECs compared to hCMEC/D3 as shown in Table 1.
Table 1
| Symbol | Gene name | Colony-OECs fold change (n=3) | Mature-OECs fold change (n=5) | p value | |
|---|---|---|---|---|---|
| ID3 | Inhibitor of DNA binding 3 | 4.5 ± 0.4 *# | 2.1 ± 1.4 | 0.008 | 0.750 |
| TNFAIP2 | Tumor necrosis factor alpha-induced protein 2 | 47.2 (13-455) # | 3.9 (1-9) | 0.018 | 0.750 |
| TGFβR1 | Transforming growth factor beta receptor 1 | 3.5 (3-28) # | 1.8 (0.7-2) | 0.030 | 0.750 |
| TGFβ1 | Transforming growth factor beta 1 | 2.2 ± 0.2 * | 1.4 ± 0.7 | 0.036 | 0.750 |
| CCL2 | Chemokine (C-C motif) ligand 2 | 48.7 (28-117) *# | 12.8 (0.7-20) | 0.036 | 0.500 |
| THBS1 | Thrombospondin 1 | 22.7 (19-23) | 5.8 (3-30) * | 0.037 | 0.375 |
| BAI 1 | Brain-specific angiogenesis inhibitor 1 | 43 (12-103) | 14.2 (2-33) * | 0.037 | 0.600 |
| MMP2 | Matrix metallopeptidase 2 | 508.7 (306-600) * | 67.2 (32-595) * | 0.042 | 0.333 |
| NRP2 | Neuropilin 2 | 76.9 (22-185) | 12.7 (9-238) * | 0.043 | 0.300 |
| TNF | Tumor necrosis factor | 320.4 (39-531) * | 0.9 (0.5-9) | 0.046 | 0.313 |
| IGF1 | Insulin-like growth factor 1 | 11393.9 (1682-13738) *# | 1.4 (0.8-8) | 0.046 | 0.341 |
| VEGFC | Vascular endothelial growth factor C | 5.7 (2-6) | 5 (3-9) * | 0.048 | 0.268 |
| MMP9 | Matrix metalloprotease 9 | 2125.8 (627-2563)*# | 0.6 (0.1-2) | 0.049 | 0.250 |
On the other hand, we observed a significant increase in
To validate our results by another technique MMP2, MMP9, VEGF-C, THBS1 and NRP-2 mRNA expression was measured using qRT-PCR. Figure 2A shows that
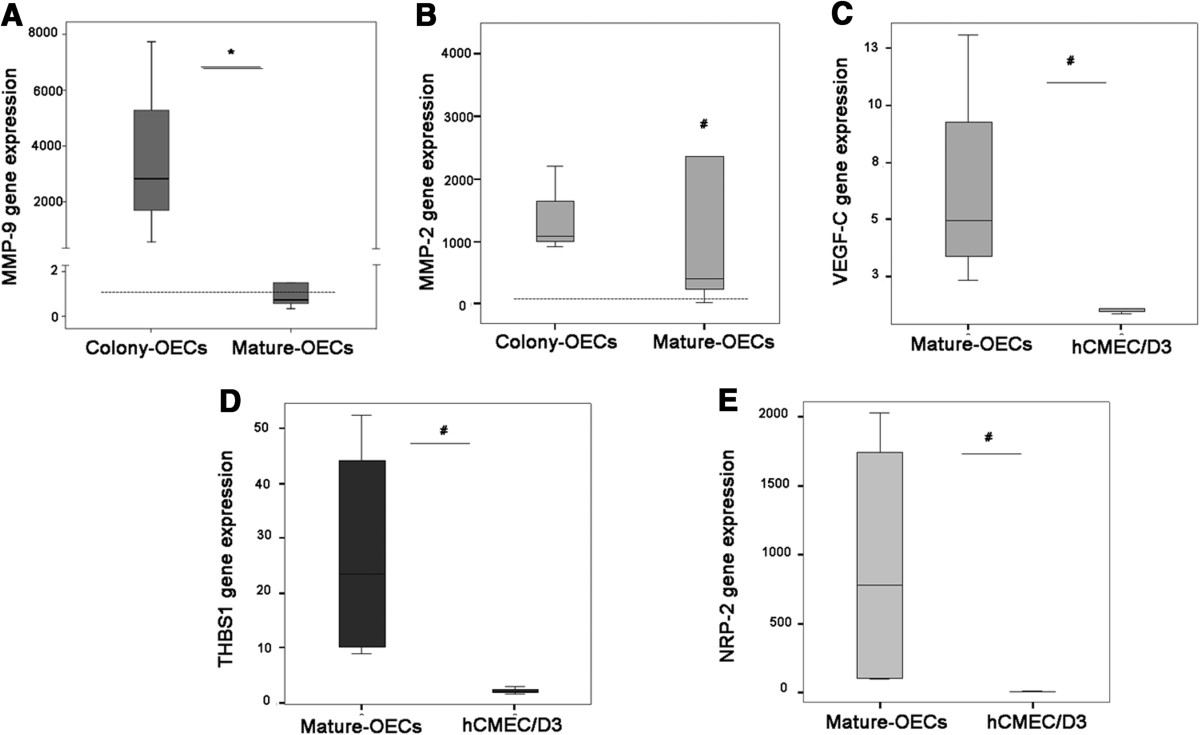
Figure 2
Figure 2 caption
Validation ofmRNA levels by qRT-PCR. A) mRNA levels in colony-OECs (n=3) and mature-OECs (n=5). B) mRNA levels in colony-OECs (n=3) and mature-OECs (n=5). C) VEGF-C gene expression levels in mature-OECs (n=4) and hCMEC/D3 (n=3). D) THBS1 mRNA levels in mature-OECs (n=4) and hCMEC/D3 (n=3). E) NRP-2 mRNA in mature-OECs (n=4) and hCMEC/D3 (n=3). Expression level is relative to calibrator sample and dashed line indicates median expression for hCMEC/D3 reference. * p<0.05 (colony vs. mature-OECs); # p<0.05 (vs. hCMEC/D3).
This data confirms the results obtained in the RT2 profiler PCR Array and validates the analysis.
Discussion
This study reveals for the first time the angiogenic gene-expression profile of OECs from ischemic stroke patients. Our results show that early colony-OECs from ischemic stroke patients display higher expression of proangiogenic-related genes, while expression of these set of genes in more mature populations (mature-OECs) is more similar to human cerebral microvascular endothelial cells.
A recent study has revealed changes in gene expression of late outgrowth EPC-derived endothelial cells from systemic sclerosis patients that could contribute to the endothelial dysfunction and may be relevant to the development of the vasculopathy [7]. However, it is completely unknown the gene expression profile of EPCs from ischemic stroke patients.
Other authors have studied the differentiation process of cord blood-derived EPCs showing that the first stage involves the expression of genes related to cell adhesion to extracellular matrix; during the second stage, gene-expression profile reveals transcription of cell cycle and antiapoptotic genes; finally, after the proliferative stage, adherent EPCs acquire additional endothelial-specific characteristics through the expression of endothelial markers [8]. Our results in the present study show that some of the genes previously described as expressed in EPCs from cord blood or peripheral blood of healthy volunteers such as
Furthermore, it is well established that secreted matrix metalloproteinases (MMPs) from EPCs have a pivotal role in the ischemia-induced neovascularization since they actively participate in matrix degradation [12]. In this context, we show that
In addition, our findings also prove the overexpression of
The current study has revealed that the gene expression profile of mature-OECs from ischemic stroke patients partially resembles that of hCMEC/D3 cells. Recently, it has been reported that OECs acquire additional endothelial-specific characteristics based on transcriptomic-, proteomic-, and ultrastructural- analysis [15]. Consistent with that study, our results also demonstrate that mature-OECs show an increase in
In the context of cerebral ischemia, the first pre-clinical studies testing the therapeutic potential of EPCs administrated early EPCs [16, 17] but lately, new studies are exploring the role of OECs [18]. It is important to define the nature of these cells in culture to identify the best population for transplantation.
A recent publication demonstrated that time in culture conditions did not alter phenotype of OECs with no significant change in antigen expression between early (passage 0–2), mid (passage 4–6) and late passage (passage 6–9) cells. Furthermore, they confirmed that late outgrowth endotelial progenitor cells resembled mature human umbilical vein endothelial cells (HUVEC) [19].
In conclusion, the present study shows that the expression pattern of the angiogenic-related genes from OECs of ischemic patents changes during their expansion but preserves the pro-angiogenic potential despite the ischemic insult. Therefore, it would be of great value to determine in which differentiation stage (i.e., whether colony or mature) would OECs be more effective in cell-based therapies, making them an attractive tool to be tested for autologous transplantation after ischemic stroke.
This study certainly includes some limitations. We included stroke patients between 24 h and 7 days after onset of symptoms because we demonstrated in a previous study that OECs from subacute strokes (obtained after 24 h of the symptoms onset) showed a higher expression and secretion of angiogenic factors than OECs obtained in the first hours following stroke [4]. However, the temporal profile of OECs maturation in terms of angiogenic factors gene expression needs to be confirmed at different time points in a larger cohort of stroke patients. We focused our study in ischemic stroke patients because cell cultures from sex- and age-matched controls did not yield OECs under the same cell culture conditions. In this regard, we have already demonstrated that circulating EPCs are reduced in control subjects compared to stroke patients [4]. Moreover, other authors have shown that hormonal status influences circulating EPC levels being significantly reduced in postmenopausal women related to reduce estradiol levels [20]. Since our control group was primarily composed by women in menopausal age (76.5%, 70.6±7.4 years old) this could also partially explain our difficulty. Finally, it would be interesting to compare gene expression patterns of OECs with those of primary endothelial cells. However, the advantage of using hCMEC/D3 cells is that they model the human blood brain barrier (BBB) and avoid the inherent variability as well as the difficulty of sourcing that apply to primary endothelial cultures. Further studies, must confirmed our results in a larger number of patients and further explored at functional level to define its biological implications.
Acknowledgements
AR is supported by the Miguel Servet programme (CP09/00265) from the Spanish Ministry of Health (Instituto de Salud Carlos III). This work has been funded by Instituto de Salud Carlos III, grant PI10/00694 and the Spanish stroke research network RENEVAS (RD06/0026/0010) co-financed by the European Regional Development Fund (ERDF). This work has been supported also by the European Union's Seventh Framework Programme (FP7/2007-2013) under grant agreements n° 201024 and n° 202213 (European Stroke Network).
Authors’ original submitted files for images
Below are the links to the authors’ original submitted files for images.
Authors’ original file for figure 1
Authors’ original file for figure 2
References
- Therapeutic stem and progenitor cell transplantation for organ vascularization and regeneration. Nat Med. 2003;9:702-712.
- Redefining endothelial progenitor cells via clonal analysis and hematopoietic stem/progenitor cell principals. Blood. 2007;109:1801-1809.
- Humanized large-scale expanded endothelial colony-forming cells function in vitro and in vivo. Blood. 2009;113:6716-6725.
- Mobilization, endothelial differentiation and functional capacity of endothelial progenitor cells after ischemic stroke. Microvasc Res. 2010;80:317-323.
- Blood–brain barrier-specific properties of a human adult brain endothelial cell line. FASEB J. 2005;19:1872-1874.
- Analysis of relative gene expression data using real-time quantitative PCR and the 2(−Delta Delta C(T)). Method. 2001;25:402-408.
- Insights into the pathogenesis of systemic sclerosis based on gene expression profile of progenitor-derived endotelial cells. Arthritis Rheum. 2011;63:3552-3562.
- Detailed molecular characterization of cord blood-derived endotelial progenitors. Exp Hematol. 2008;36:193-203.
- Impaired recruitment of bone-marrow-derived endothelial and hematopoietic precursor cells blocks tumor angiogenesis and growth. Nat Med. 2001;7:1194-1201.
- Age-dependent impairment of endothelial progenitor cells is corrected by growth-hormone-mediated increase of insulin-like growth-factor-1. Circ Res. 2007;100:434-443.
- Soluble factors released by endothelial progenitor cells promote migration of endothelial cells and cardiac resident progenitor cells. J Mol Cell Cardiol. 2005;39:733-742.
- Matrix metalloproteinase-9 is essential for ischemia-induced neovascularization by modulating bone marrow-derived endothelial progenitor cells. Arterioscler Thromb Vasc Biol. 2009;29:1179-1184.
- Endothelial progenitor cells give rise to pro-angiogenic smooth muscle-like progeny. Cardiovasc Res. 2010;86:506-515.
- Endothelial progenitor cells induce a phenotype shift in differentiated endothelial cells towards PDGF/PDGFRβ axis-mediated angiogenesis. PLoS One. 2010;5:e14107-.
- Molecular analysis of endothelial progenitor cell (EPC) subtypes reveals two distinct cell populations with different identities. BMC Med Genomics. 2010;3:18-.
- Administration of ex vivo-expanded bone marrow-derived endothelial progenitor cells attenuates focal cerebral ischemia-reperfusion injury in rats. Neurosurgery. 2006;59:679-686.
- Endothelial progenitor cell transplantation improves long-term stroke outcome in mice. Ann Neurol. 2010;67:488-497.
- Transplanted late outgrowth endothelial progenitor cells as cell therapy product for stroke. Stem Cell Rev. 2011;7:208-220.
- Late outgrowth endothelial cells resemble mature endothelial cells and are not derived from bone marrow. Stem Cells. 2012.
- Hormonal status modulates circulating endotelial progenitor cells. Clin Res Cardiol. 2007;96:258-263.

The present article has been published in Vascular Cell journal by Publiverse Online S.R.L.