Gene expression analysis reveals marked differences in the transcriptome of infantile hemangioma endothelial cells compared to normal dermal microvascular endothelial cells
Vascular Cell. 2013;
Received: 24 January 2013 | Accepted: 13 March 2013 | Published: 25 March 2013
Vascular Cell ISSN: 2045-824X
Abstract
Background
Infantile hemangiomas are benign vascular tumors primarily found on the skin in 10% of the pediatric population. The etiology of this disease is largely unknown and while large scale genomic studies have examined the transcriptomes of infantile hemangioma tumors as a whole, no study to date has compared the global gene expression profiles of pure infantile hemangioma endothelial cells (HEMECs) to that of normal human dermal microvascular endothelial cells (HDMVECs).
Methods
To shed light on the molecular differences between these normal and aberrant dermal endothelial cell types, we performed whole genome microarray analysis on purified cultures of HEMECs and HDMVECs. We then utilized qPCR and immunohistochemistry to confirm our microarray results.
Results
Our array analysis identified 125 genes whose expression was upregulated and 104 genes whose expression was downregulated by greater than two fold in HEMECs compared to HDMVECs. Bioinformatics analysis revealed three major classifications of gene functions that were altered in HEMECs including cell adhesion, cell cycle, and arachidonic acid production. Several of these genes have been reported to be critical regulators and/or mutated in cancer, vascular tumors, and vascular malformations. We confirmed the expression of a subset of these differentially expressed genes (ANGPT2, ANTXR1, SMARCE1, RGS5, CTAG2, LTBP2, CLDN11, and KISS1) using qPCR and utilized immunohistochemistry on a panel of paraffin embedded infantile hemangioma tumor tissues to demonstrate that the cancer/testis antigen CTAG2 is highly abundant in vessel-dense proliferating infantile hemangiomas and with significantly reduced levels during tumor involution as vascular density decreases.
Conclusion
Our data reveal that the transcriptome of HEMECs is reflective of a pro-proliferative cell type with altered adhesive characteristics. Moveover, HEMECs show altered expression of many genes that are important in the progression and prognosis of metastatic cancers.
Introduction
Infantile hemangiomas are benign tumors of vascular origin that affect approximately 10% of the pediatric population. These tumors are characterized by a rapid proliferation phase over the first 1–2 years of the child’s life, followed by a slow and steady decline over the next 5–7 years leading to the complete involution of the tumor mass. Approximately 90% of all infantile hemangiomas remain small and are best left alone to naturally involute. However in about 10% of the cases the tumors exhibit aggressive characteristics based on their size, location, number, etc. and must be actively treated to avoid patient disfigurement and/or mortality.
The etiology of infantile hemangiomas is largely unknown, particularly with regard to the cellular origin of the tumor. Circumstantial evidence suggests that these lesions are of aberrant placental origin as evidenced by upregulated Glut1 expression [1], and some labs have ventured to hypothesize that they may be formed from metastatic invasion of placenta-derived chorangioma cells [2]. Indeed, transcriptional profiling of human placenta, infantile hemangioma, and eight normal and diseased vascularized tissues suggests that high transcriptome similarity is shared between placenta and hemangioma tissues, more so than any of the other tissues tested [3]. Global gene expression analysis of infantile hemangioma tumors has been previously performed by two labs. Ritter et al. [4] utilized microarray analysis on whole tumors and identified immune regulators and indoleamine 2,3 dioxygenase as key regulators of infantile hemangioma involution. Calicchio et al. [5] utilized laser capture microdissection and genome-wide transcriptional profiling of vessels from proliferating and involuting hemangiomas. The authors strongly associated proliferating hemangioma vessels with increased expression of genes involved in endothelial-pericyte interactions and neuronal/vascular patterning, and involuting hemangiomas with chronic inflammatory mediators and angiogenic inhibitors. Given the high density of tightly associated pericytes in infantile hemangiomas and the inevitable collateral capture of intraluminal white cells, fibroblasts, mast cells, and perivascular collagen with laser microdissection, these data represent changes from numerous cell types within the infantile hemangioma tumor, but are not reflective specifically of the aberrant endothelial cells which contribute to disease. While these genomics studies have provided great mechanistic insight into the etiology and progression of the disease, they have not addressed the unique differences between abnormal infantile hemangioma endothelial cells and the normal dermal endothelial cells that are resident in the surrounding skin area of the patient. Understanding these differences could identify targetable pathways that could be exploited to preferentially block hemangioma growth and spread, but spare normal endothelial cells.
To date, no direct whole genome comparison of pure cultures of human dermal microvascular endothelial cells (HDMVECs) and infantile hemangioma endothelial cells (HEMECs) has been reported. To address this, we performed whole genome microarray profiling of the gene expression alterations between low passage pure cultures of HEMECs and HDMVECs. We identified a number of transcriptional alterations that are likely to contribute to the aggressive phenotype of infantile hemangiomas and that could potentially be utilized in immunotherapy against particularly aggressive hemangiomas tumors.
Materials and methods
Cell culture and chemicals
The HEMEC cell line was previously isolated from a proliferating-phase infantile hemangioma specimen collected from a female infant and generously donated to us by Joyce Bischoff (Harvard Medical School) [6]. The primary culture of neonatal HDMVECs was purchased from ATCC. Both cell lines were cultured as previously reported [7]. For all experiments, cell lines were used at <5 passages.
Proliferation assay
Cells were plated at equivalent sub-confluent densities and maintained in a Nikon Biostation CT time lapse imaging station. Cell proliferation was measured by counting cells per vision field from 5 independent areas over a 96 hour time course. Data presented is the average of the counts plus or minus the standard deviation. Student’s
Migration assay
Confluent cultures were scratch wounded and the progress of “wound healing” was monitored using a Nikon Biostation CT time lapse imaging station over a 9 hour period. Data presented is the average migration speed plus or minus the standard deviation. Student’s
Immunofluorescence
Cells were plated onto collagen type I coated glass coverslips, fixed in 4% paraformaldehyde, and incubated with antibodies against phospho-focal adhesion kinase (p-FAK; 1:1000; Cell Signaling #3283), rhodamine conjugated phalloidin (1:350; Cytoskeleton Inc.), or DAPI and imaged via a Nikon Eclipse Ti laser scanning confocal microscope.
Microarray analysis
Total RNA was amplified and biotin-labeled using Illumina TotalPrep RNA Amplification Kit (Ambion). 750 ng of biotinylated aRNA was then briefly heat-denatured and loaded onto expression arrays to hybridize overnight. Following hybridization, arrays were labeled with Cy3-streptavidin and imaged on the Illumina ISCAN. Intensity values were transferred to Agilent GeneSpring GX microarray analysis software and data was filtered based on quality of each call. Statistical relevance was determined using ANOVA with a Benjamini Hochberg FDR multiple testing correction (p-value < 0.05). Data were then limited by fold change analysis to statistically relevant data points demonstrating a 2-fold or more change in expression. Pathway analysis was performed using Metacore software. The microarray data from this experiment is publically available on the Gene Expression Omnibus (GEO Accession #GSE43742).
Quantitative real time PCR analysis
RNA was isolated from cells using the Ambion Purelink Minikit according to the manufacturer’s directions. qRT-PCR was performed on an ABI7900HT RT-PCR system using TaqMan Assays with predesigned primer sets for the genes of interest (Invitrogen). All RT-PCR experiments were performed in triplicate.
Immunohistochemistry
Paraffinized infantile hemangioma tissues were labeled with CTAG2 antibody (1:200, Santa Cruz Biotechnology #sc99243) and quantified using Alkaline Phosphatase detection (CellMarque). Positive and negative controls from breast carcinoma tissues were stained with CTAG2 antibody or sham, respectively. Use of de-identified human tissues was approved by the Texas Tech University Health Sciences Center Institutional Review Board for the Protection of Human Subjects (IRB E13029). Waiver of informed consent was approved by IRB.
Results and discussion
A comparison of the proliferation and migration rates of HEMECs and HDMVECs under standard growth conditions revealed no significant difference between normal and hemangioma endothelial cell types, however HEMECs grown under reduced serum conditions (0.5% fetal bovine serum) exhibited an approximately 30% increase in proliferation and an approximately 18% increase in migration relative to HDMVECs grown under the same conditions (Figure 1A & B). This suggests the higher serum concentrations were likely masking any phenotypic advantage attributed to the HEMECs. Moreover, it indicates the proliferative and migratory capacity of HEMECs are unique from that observed in HDMVECs and agrees with earlier reports suggesting advantages in these areas for HEMECs [6]. Comparisons of fluorescent images of the actin cytoskeleton and active focal adhesion complexes obtained with confocal microscopy revealed that HDMVECs display primarily peripheral membrane localized p-FAK, indicating sites of cellular attachment to the extracellular matrix (ECM) (Figure 1C). In contrast, p-FAK localization in HEMECs was observed along the entirety of the actin stress fibers, suggesting cellular adhesion to its substrate is markedly altered in HEMECs. Indeed, it has previously been reported that HEMECs display unique expression of genes involved in cellular adhesion [8].
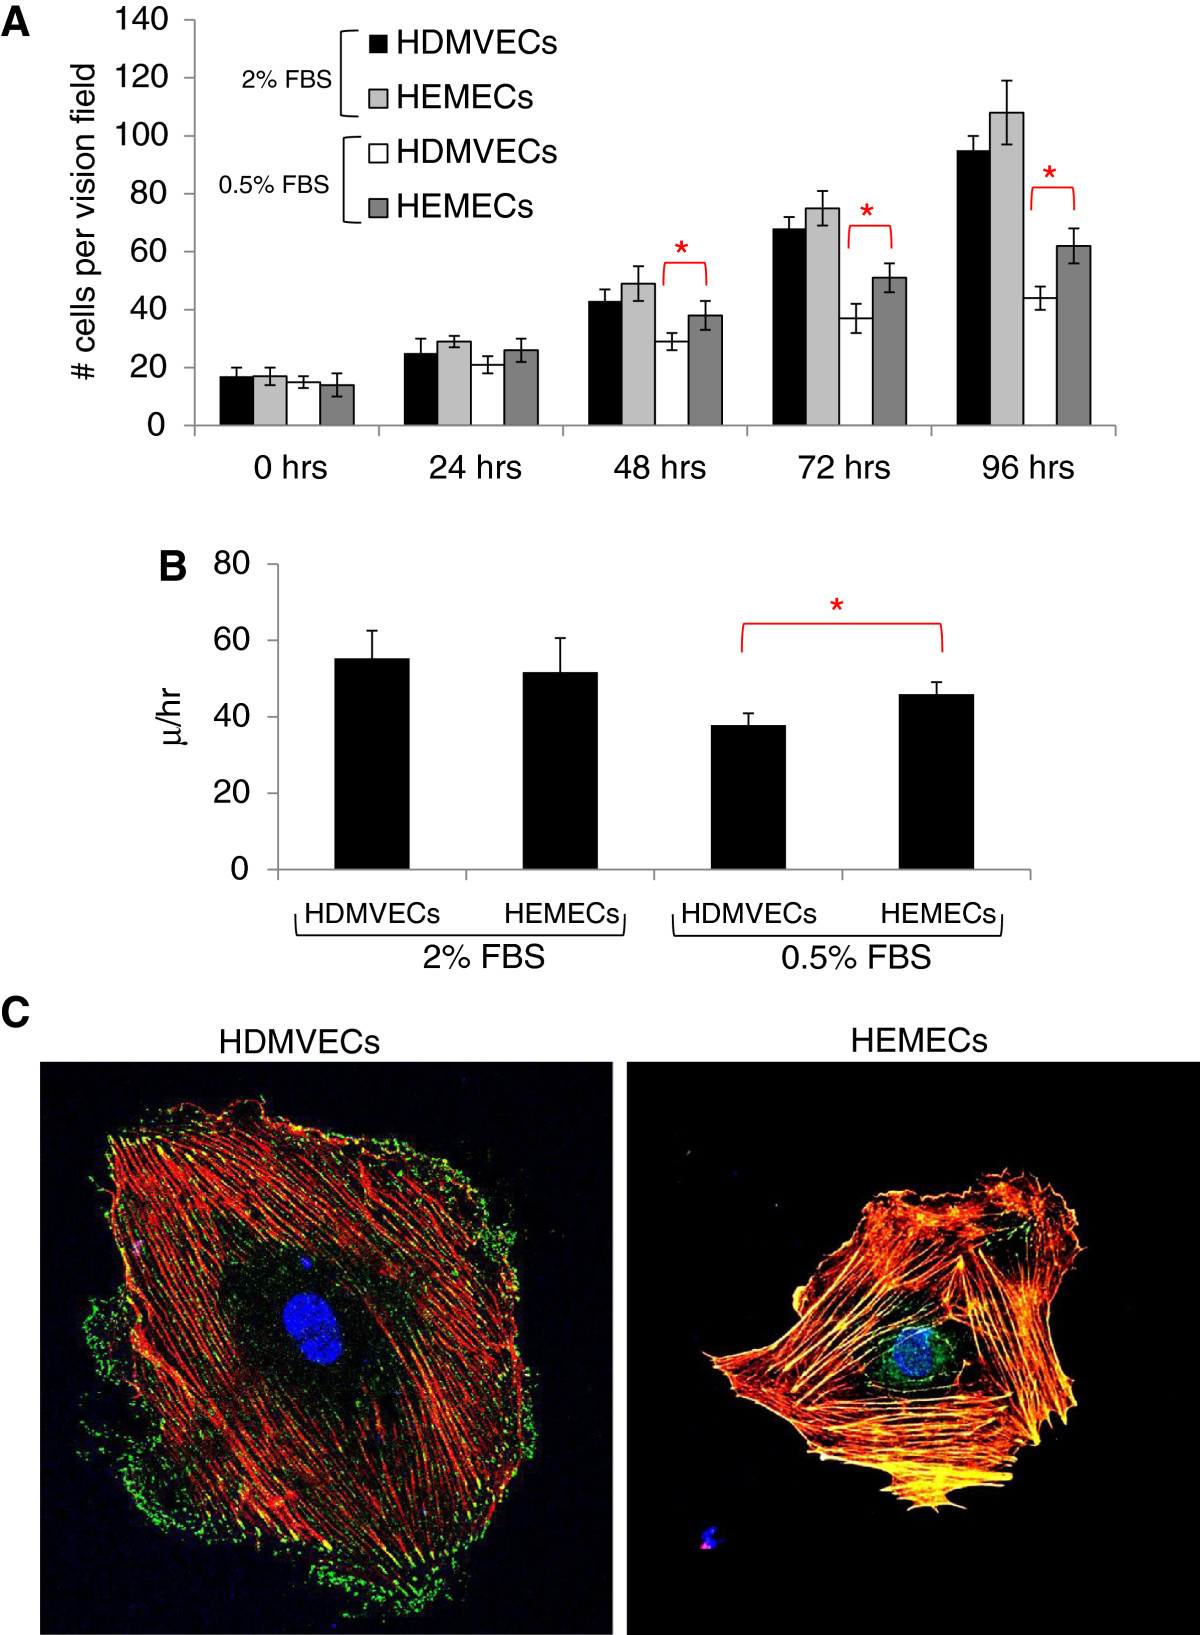
Figure 1
Figure 1 caption
Analysis of HDMVEC and HEMEC phenotypes. (A) Analysis of proliferation rates between HDMVECs and HEMECs over a 48 hr time course. (B) Analysis of the migration rates of HDMVECs and HEMECs nine hours after initial scratch from a micropipette. (C) Immunofluorescent imaging of actin (), p-FAK (), and nucleus (). (red asterisks for panels A &B represent statistically significant values [p<0.05] as determined by Student’s -test).
Whole genome microarray analysis reveals large scale alterations in gene expression between HEMECs and HDMVECs
Given the phenotypic differences observed between HEMECs and HDMVECs, we compared the global gene expression patterns between pure cultures of these cells using Illumina high density BeadArrays to elucidate which molecular factors are deregulated in HEMECs. Our array analysis identified 125 genes whose expression was upregulated and 104 genes whose expression was downregulated (2 fold or greater, p<0.05) in HEMECs compared to HDMVECs (Table 1). Metacore analysis of the 2 fold or greater gene expression changes revealed three major classifications of gene functions that are altered in HEMECs including cell adhesion (
Table 1
| Gene symbol | Gene name | Accession number | FC |
|---|---|---|---|
| CTAG2 | Cancer/testis antigen 2 | NM_020994.3 | 11.6 |
| IL13RA2 | Interleukin 13 Receptor, alpha 2 | NM_000640.2 | 10.7 |
| IFI27 | Interferon, alpha-inducible protein 27 | NM_005532.3 | 8.3 |
| TPM2 | Tropomyosin 2 (beta) | NM_213674.1 | 7.8 |
| RPL14 | Ribosomal protein L14 | NM_001034996.1 | 6.6 |
| CCNA1 | Cyclin A1 | NM_003914.3 | 6.6 |
| RGS5 | G-protein signaling 5 regulator | NM_003617.3 | 6.0 |
| FBN2 | Fibrillin 2 | NM_001999.3 | 5.9 |
| D4S234E | DNA segment on chromosome 4 (unique) | NM_001040101.1 | 5.5 |
| BST2 | Bone marrow stromal cell antigen 2 | NM_004335.2 | 5.1 |
| QPCT | Glutaminyl-peptide cyclotransferase | NM_012413.3 | 4.8 |
| TNFSF4 | Tumor necrosis factor (ligand) superfamily, member 4 | NM_003326.3 | 4.6 |
| RGS5 | Regulator of G-protein signaling 5 | NM_003617.3 | 4.6 |
| SPOCK1 | Sparc/osteonectin, cwcv and kazal-like domains proteoglycan 1 | NM_004598.3 | 4.6 |
| SNHG8 | Small nucleolar RNA host gene 8 (non-protein coding) | NR_003584.3 | 4.6 |
| ANTXR1 | Anthrax toxin receptor 1 | NM_032208.2 | 4.5 |
| CHST1 | Carbohydrate sulfotransferase 1 | NM_003654.5 | 4.5 |
| MPZL2 | Myelin protein zero-like 2 | NM_005797.3 | 4.4 |
| HEY2 | Hairy/enhancer-of-spilt related with YRPW motif 2 | NM_012259.2 | 4.3 |
| SLITRK4 | SLIT and NTRK-like family, member 4 | NM_173078.3 | 4.2 |
| SHISA2 | Shisa homolog 2 | NM_001007538.1 | 4.0 |
| LRRC17 | Leucine rich repeat containing 17, TV2 | NM_005824.2 | 3.9 |
| NUDT11 | Nudix-type motif 11 | NM_018159.3 | 3.8 |
| RNASE1 | Ribonuclease, Rnase A family, 1, TV1 | NM_198235.2 | 3.7 |
| SERPINE2 | Serpin peptidase inhibitor, clade E, member 2 | NM_006216.3 | 3.6 |
| LIPG | Lipase, endothelial | NM_006033.2 | 3.4 |
| PCSK5 | Proprotein convertase subtilisin/kexin type 5 | NM_006200.3 | 3.4 |
| LPXN | Leupaxin | NM_004811.2 | 3.3 |
| CXCR4 | Chmeokine (C-X-C motif) receptor 4, TV2 | NM_003467.2 | 3.2 |
| TMEM200A | Transmembrane protein 200A | NM_052913.2 | 3.1 |
| CXCR4 | Chemokine (C-X-C motif) receptor 4, TV1 | NM_001008540.1 | 3.1 |
| RAB34 | RAB34, member RAS onogene family | NM_031934.5 | 3.0 |
| DPYSL3 | Dihydropyrimidinase-like 3 | NM_001387.2 | 2.9 |
| FBXL13 | F-box and leucine-rich repeat protein 13 | NM_145032.3 | 2.9 |
| PNMA2 | Paraneoplastic Ma antigen 2 | NM_007257.5 | 2.9 |
| LOC440354 | LOC440354 | NR_002473.2 | 2.9 |
| NLGN1 | Neuroligin 1 | NM_014932.2 | 2.8 |
| DDIT4 | DNA-damage-inducible transcript 4 | NM_019058.2 | 2.8 |
| PFN2 | Profilin 2 | NM_053024.3 | 2.8 |
| GABBR2 | Gamma-aminobutyric acid B receptor, 2 | NM_005458.7 | 2.8 |
| MEIS2 | Meis homeobox 2 | NM_172315.2 | 2.7 |
| PMEPA1 | Prostate transmembrane protein, androgen induced 1 | NM_199169.2 | 2.7 |
| LOC647307 | LOC647308 | XR_039752.1 | 2.7 |
| PLEK2 | Pleckstrin 2 | NM_016445.1 | 2.7 |
| CARD11 | Caspase recruitment domain family, member 11 | NM_032415.4 | 2.6 |
| SNORD13 | Small nucleolar RNA, C/D box 13, small nucleolar RNA | NR_003041.1 | 2.6 |
| GFPT2 | Glutamine-fructoce-6-phosphate transaminase 2 | NM_005110.2 | 2.6 |
| FAP | Fibroblast activation protein, alpha | NM_004460.2 | 2.6 |
| OCIAD2 | OCIA domain containing 2, TV2 | NM_152398.2 | 2.5 |
| F2RL1 | Coagulation factor II receptor-like 1 | NM_005242.4 | 2.5 |
| DSTYK | Dual serine/threonine and tyrosine protein kinase | NM_199462.2 | 2.5 |
| LOC649497 | LOC649498 | XM_938576.1 | 2.5 |
| LOC654194 | LOC654195 | XM_942669.1 | 2.5 |
| NYNRIN | NYN domain and retroviral integrase containing | NM_025081.2 | 2.5 |
| LOC387763 | LOC387764 | XM_941665.2 | 2.5 |
| COL8A1 | Collagen, type VIII, alpha 1 | NM_020351.3 | 2.5 |
| MGC39900 | MGC39901 | XM_936687.1 | 2.4 |
| LTBP2 | Latent transforming growth factor beta binding protein 2 | NM_000428.2 | 2.4 |
| RNASE1 | Ribonuclease, Rnase A family, 1, TV3 | NM_198232.2 | 2.4 |
| IFI27L2 | Interferon, alpha-inducible protein 27-like 2 | NM_032036.2 | 2.4 |
| SOX4 | SRY (sex determining region Y)-box4 | NM_003107.2 | 2.4 |
| LRRC17 | Leucine rich repeat containing 17, TV1 | NM_001031692.2 | 2.3 |
| DSE | Dermatan sulfate epimerase | NM_013352.2 | 2.3 |
| CD44 | CD44 molecule (Indian blood group), TV5 | NM_001001392.1 | 2.3 |
| LOC100131139 | LOC100131140 | XR_037336.1 | 2.3 |
| CBS | Systathionine-beta-synthase | NM_000071.2 | 2.3 |
| NT5DC2 | 5'-nucleotidase domain containing 2 | NM_022908.2 | 2.3 |
| NPFFR2 | Neuropeptide FF receptor 2 | NM_004885.2 | 2.3 |
| LOC100129685 | LOC100129686 | XM_001723814.1 | 2.3 |
| LXN | Latexin | NM_020169.3 | 2.3 |
| MEX3B | Mex-3 homolog B | NM_032246.3 | 2.3 |
| C1orf54 | Chromosome 1 open reading frame 54 | NM_024579.3 | 2.3 |
| HDDC2 | HD domain containing 2 | NM_016063.2 | 2.3 |
| LOC648823 | LOC648824 | XM_943477.1 | 2.3 |
| CYB5A | Cytochrome b5 type A | NM_001914.3 | 2.3 |
| PIR | Pirin (iron binding nuclear protein) | NM_001018109.2 | 2.3 |
| GPR37 | G protein-coupled receptor 37 | NM_005302.2 | 2.3 |
| PPAPDC1A | Phosphatidic acid phosphatase type 2 domain containing 1A | NM_001030059.1 | 2.3 |
| CD44 | CD44 molecule (Indian blood group), TV4 | NM_001001391.1 | 2.2 |
| LOC100131905 | LOC100131906 | XR_039334.1 | 2.2 |
| CTAG1A | Cancer/testis antigen 1A | NM_139250.1 | 2.2 |
| C4orf18 | Chromosome 4 open reading frame 18 | NM_016613.6 | 2.2 |
| LDOC1 | Leucine zipper, down-regulated in cancer 1 | NM_012317.2 | 2.2 |
| TGFBI | Transforming growth factor, beta-induced | NM_000358.2 | 2.2 |
| COL5A2 | Collagen, type V, alpha 2 | NM_000393.3 | 2.2 |
| NOX4 | NADPH oxidase 4 | NM_016931.3 | 2.2 |
| TSHZ3 | Teashirt zinc finger homeobox 3 | NM_020856.2 | 2.2 |
| FNDC3B | Fibronectin type III domain containing 3B, TV2 | NM_001135095.1 | 2.2 |
| KIT | V-kit | NM_001093772.1 | 2.2 |
| ADAM19 | ADAM metallopeptidase domain 19 | NM_033274.3 | 2.2 |
| JAM3 | Junctional adhesion molecule 3 | NM_032801.4 | 2.1 |
| CGNL1 | Cingulin-like 1 | NM_032866.4 | 2.1 |
| COL4A6 | Collagen, type IV, alpha 6 | NM_001847.2 | 2.1 |
| BMX | BMX non-receptor tyrosine kinase | NM_001721.6 | 2.1 |
| DUSP23 | Dual specificity phosphatase 23 | NM_017823.3 | 2.1 |
| MMP2 | Matrix metallopeptidase 2 | NM_004530.4 | 2.1 |
| NCAPD2 | Non-SMC condensin I complex, subunit D2 | NM_014865.3 | 2.1 |
| CYBRD1 | Cytochrome b reductase 1, TV1 | NM_024843.2 | 2.1 |
| FAM89A | Family with sequence similarity 89, member A | NM_198552.2 | 2.1 |
| GAS6 | Growth arrest-specific 6 | NM_000820.2 | 2.1 |
| S100A13 | S100 calcium binding protein A13 | NM_001024211.1 | 2.1 |
| SMARCE1 | SWI/SNF related, subfamily e, member 1 | NM_003079.4 | 2.1 |
| LOC643977 | LOC643978 | XM_932991.1 | 2.1 |
| LFNG | O-fucosylpeptide 3-beta-N-acetylglucosaminyltransferase | NM_001040167.1 | 2.1 |
| MTMR11 | Myotubularin related protein 11 | NM_181873.3 | 2.1 |
| ITGA10 | Integrin, alpha 10 | NM_003637.3 | 2.1 |
| PTGFRN | Prostaglandin F2 receptor negative regulator | NM_020440.2 | 2.0 |
| LOC644936 | Actin, beta pseudogene | NR_004845.1 | 2.0 |
| CPS1 | Carbamoyl-phosphate synthase 1, mitochonfrial | NM_001875.4 | 2.0 |
| C18orf56 | Chromosome 18 open reading frame 56 | NM_001012716.2 | 2.0 |
| ADA | Adenosine deaminase | NM_000022.2 | 2.0 |
| NETO2 | Neuropilin and tolliod-like2 | NM_018092.4 | 2.0 |
| DKFZp761P0423 | DKFZp761P0424 | XM_291277.4 | 2.0 |
| STC2 | Stanniocalcin 2 | NM_003714.2 | 2.0 |
| PRKAR1A | Protein kinase, cAMP-dependent, regulatory, type I, alpha | NM_002734.3 | 2.0 |
| EGFLAM | EGF-like, fibronectin type III and laminin G domains | NM_182801.2 | 2.0 |
| SPECC1 | Sperm antigen with calponin homology, coiled-coil domains 1 | NM_001033555.2 | 2.0 |
| FNDC3B | Fibronectin type III domain containing 3B, TV1 | NM_022763.3 | 2.0 |
| THOC3 | THO complex 3 | NM_032361.2 | 2.0 |
| COL5A1 | Collagen, type V, alpha 1 | NM_000093.3 | 2.0 |
| LANCL1 | LanC lantibiotic synthetase component C-like 1 | NM_006055.2 | 2.0 |
| OCIAD2 | OCIA domain containing 2, TV1 | NM_001014446.1 | 2.0 |
| LRIG1 | Leucine-rich repeats and immunoglobulin-like domains 1 | NM_015541.2 | 2.0 |
| HOXB2 | Homeobox B2 | NM_002145.3 | 2.0 |
| TIMP1 | TIMP metallopeptidase inhibitor 1 | NM_003254.2 | −2.0 |
| NAAA | N-acylethanolamine acid amidase | NM_014435.3 | −2.0 |
| MAOA | Monoamine oxidase A | NM_000240.2 | −2.0 |
| MYOF | Myoferlin | NM_013451.3 | −2.0 |
| KISS1 | KiSS metastasis-suppressor | NM_002256.3 | −2.0 |
| SLC25A22 | Solute carrier family 25, member 22 | NM_024698.5 | −2.0 |
| NOSIP | Nitric oxide synthase interacting protein | NM_015953.3 | −2.0 |
| COL1A2 | Collagen, type I, alpha 2 | NM_000089.3 | −2.0 |
| ZDHHC14 | Zinc finger, DHHC-type containing 14 | NM_024630.2 | −2.0 |
| HPCAL1 | Hippocalcin-like 1 | NM_134421.1 | −2.0 |
| VLDLR | Very low density lipoprotein receptor | NM_001018056.1 | −2.0 |
| LOC730525 | LOC730525 | XM_001126202.1 | −2.0 |
| BMP2 | Bone morphogenetic protein 2 | NM_001200.2 | −2.0 |
| ABLIM1 | Actin binding LIM protein 1 | NM_006720.3 | −2.0 |
| PIK3C2A | Phosphoinositide-3-kinase, class 2, alpha polypeptide | NM_002645.2 | −2.0 |
| IRF1 | Interferon regulatory factor 1 | NM_002198.2 | −2.0 |
| MBP | Myelin basic protein | NM_001025100.1 | −2.0 |
| PRKAR1B | Protein kinase, cAMP-dependent, regulatory type I, beta | NM_002735.2 | −2.1 |
| FAM101B | Family with sequence similarity 101, member B | NM_182705.2 | −2.1 |
| ERCC2 | DNA excision repair protein 2 | NM_000400.3 | −2.1 |
| CCND2 | Cyclin D2 | NM_001759.3 | −2.1 |
| HLA-B | Major histocompatibility complex, class I, B | NM_005514.6 | −2.1 |
| SYBU | Syntabulin | NM_001099743.1 | −2.1 |
| PDE2A | Phosphodiesterase 2A, cGMP-stimulated | NM_002599.4 | −2.1 |
| AKAP12 | A kinase anchor protein 12 | NM_005100.3 | −2.1 |
| CLEC2B | C-type lectin domain family 2, member B | NM_005127.2 | −2.1 |
| S100A4 | S100 calcuim binding protein A4 | NM_019554.2 | −2.1 |
| FST | Follistain | NM_013409.2 | −2.2 |
| SLC30A3 | Solute carrier family 30, member 3 | NM_003459.4 | −2.2 |
| PLIN2 | Perilipin 2 | NM_001122.3 | −2.2 |
| IL32 | Interleukin 32 | NM_001012633.1 | −2.2 |
| LOC100128252 | LOC100128253 | XM_001725603.1 | −2.2 |
| TIMM22 | Translocase of inner mitochondrial membrane 22 homolog | NM_013337.2 | −2.2 |
| SYNM | Synemin, intermediate filament protein | NM_015286.5 | −2.2 |
| LOC729985 | LOC729986 | XM_001131964.1 | −2.2 |
| ADRB2 | Adrenergic, beta-2-, receptor surface | NM_000024.5 | −2.2 |
| KIAA1274 | KIAA1274 | NM_014431.2 | −2.2 |
| PRR5 | Proline rich 5 | NM_001017529.2 | −2.2 |
| LOC387841 | LOC387842 | XM_932678.1 | −2.3 |
| CFI | Complement factor I | NM_000204.3 | −2.3 |
| LOC646836 | LOC646837 | XM_001718162.1 | −2.3 |
| COL1A1 | Collagen, type I, alpha 1 | NM_000088.3 | −2.3 |
| CCL2 | Chemokine (C-C motif) ligand 2 | NM_002982.3 | −2.3 |
| COL6A1 | Collagen, type VI, alpha 1 | NM_001848.2 | −2.3 |
| LOC201651 | LOC201652 | XR_017321.2 | −2.3 |
| GALNTL4 | GalNAc-T-like protein 4 | NM_198516.2 | −2.3 |
| S100A3 | S100 calcuim binding protein A3 | NM_002960.1 | −2.4 |
| ALDH1A1 | Aldehyde dehydrogenase 1 family, member A1 | NM_000689.4 | −2.4 |
| TNFRSF14 | Tumor necosis factor receptor superfamily, member 14 | NM_003820.2 | −2.4 |
| CAV1 | Caveolin 1 | NM_001753.4 | −2.4 |
| LAMC2 | Laminin, gamma 2 | NM_005562.2 | −2.4 |
| NOSTRIN | Nitric oxide synthase trafficker | NM_052946.3 | −2.4 |
| CEACAM1 | Carcinoembryonic antigen-related cell adhesion molecule 1 | NM_001024912.2 | −2.4 |
| CYYR1 | Cysteine/tyrosine-rich 1 | NM_052954.2 | −2.5 |
| SLC22A23 | Solute carrier family 22, member 23 | NM_021945.5 | −2.5 |
| ACSL5 | Acyl-CoA synthetase long-chain family member 5 | NM_016234.3 | −2.5 |
| AADAC | Arylacetamide deacetylase | NM_001086.2 | −2.6 |
| COLEC12 | Collectin sub-family member 12 | NM_130386.2 | −2.6 |
| KIAA1324L | KIAA1324-like | NM_152748.3 | −2.6 |
| RNASET2 | Ribonuclease T2 | NM_003730.4 | −2.6 |
| NXN | Nucleoredoxin | NM_022463.4 | −2.6 |
| PLA2G4C | Phospholipase A2, group IVC | NM_003706.2 | −2.6 |
| SERPINB2 | Serpin peptidase inhibitor, clade B, member 2 | NM_002575.2 | −2.6 |
| CETP | Cholesteryl ester transfer protein, plasma | NM_000078.2 | −2.7 |
| PLA2G16 | Phospholipase A2, group XVI | NM_007069.3 | −2.7 |
| TNFSF18 | Tumor necrosis factor superfamily, member 18 | NM_005092.3 | −2.8 |
| CITED2 | Cbp/p300-interacting transactivator 2 | NM_006079.3 | −2.8 |
| C10orf116 | Chromosome 10 open reading fame 116 | NM_006829.2 | −2.8 |
| PROX1 | Prospero homeobox 1 | NM_002763.3 | −2.9 |
| PALM | Paralemmin | NM_002579.2 | −2.9 |
| ZSCAN18 | Zinc finger and SCAN domain containing 18 | NM_023926.4 | −2.9 |
| LEPREL1 | Leprecan-like 1 | NM_018192.3 | −2.9 |
| CTSH | Cathepsin H | NM_004390.3 | −2.9 |
| KHDRBS3 | RNA-binding protein T-Star | NM_006558.1 | −3.0 |
| CDH11 | Cadherin 11, type 2, OB-cadherin | NM_001797.2 | −3.1 |
| DDIT4L | DNA-damage-inducible transcript 4-like | NM_145244.3 | −3.2 |
| GAPDHL6 | GAPDHL7 | XM_001726954.1 | −3.2 |
| NR5A2 | Nuclear receptor subfamily 5, group A, member 2 | NM_003822.3 | −3.3 |
| ABCA3 | ATP-binding cassette, sub-family A, member 3 | NM_001089.2 | −3.3 |
| MARCH2 | Membrane-associated ring finger 2 | NM_001005416.1 | −3.3 |
| CDKN2A | Cyclin-dependent kinase inhibitor 2A | NM_000077.4 | −3.3 |
| MGP | Matrix Gla protein | NM_000900.3 | −3.3 |
| ALDH1A2 | Aldehyde dehydrogenase 1 family, member A2 | NM_170697.2 | −3.5 |
| HOXB7 | Homeobox B7 | NM_004502.3 | −3.5 |
| EMCN | Endomucin | NM_016242.3 | −3.5 |
| ANGPT2 | Angiopoietin 2 | NM_001147.2 | −3.5 |
| GIMAP5 | GTPase, IMAP family member 5 | NM_018384.4 | −3.6 |
| NDN | Necdin homolog | NM_002487.2 | −3.8 |
| TACSTD2 | Tumor associate calcuim signal transducer 2 | NM_002353.2 | −3.8 |
| KRT19 | Keratin 19 | NM_002276.4 | −3.8 |
| FAM174B | Family with sequence similarity 174, member B | NM_207446.2 | −3.9 |
| CECR1 | Cat eye syndrome chromosome region, candidate 1 | NM_177405.1 | −4.2 |
| GPR116 | G protein-coupled receptor 116 | NM_015234.4 | −4.3 |
| TNFRSF6B | Tumor necrosis factor superfamily, member 6b, decoy | NM_032945.2 | −4.3 |
| PIEZO2 | Piezo-type mechanosensitive ion channel component 2 | NM_022068.2 | −4.4 |
| UCHL1 | Ubiquitin carboxyl-terminal esterase L1 | NM_004181.4 | −4.9 |
| KBTBD11 | Kelch repeat and BTB domain containing 11 | NM_014867.2 | −5.3 |
| LOC375295 | LOC375296 | XM_374020.4 | −5.5 |
| HSD17B2 | Hydroxysteroid dehydrogenase 2 | NM_002153.2 | −8.4 |
| LYVE1 | Lymphatic vessel endothelial hyaluronan receptor 1 | NM_006691.3 | −8.8 |
| PDPN | Podoplanin | NM_001006625.1 | −15.8 |
| GYPC | Glycophorin C | NM_016815.3 | −22.6 |
| MMP1 | Matrix metallopeptidase 1 | NM_002421.3 | −25.8 |
| FABP4 | Fatty acid binding protein 4, adipocyte | NM_001442.2 | −28.1 |
| CLDN11 | Claudin 11 | NM_005602.5 | −36.9 |
We confirmed a small subset of these gene expression changes utilizing qPCR, revealing equivocal trends in gene expression between the microarray and qPCR data for
Table 2
| Gene | Expression Δ |
|---|---|
| RGS5 | 92.4 ± 11.2 |
| CTAG2 | 39.9 ± 4.8 |
| SMARCE1 | 4.4 ± 1.4 |
| LTBP2 | 3.3 ± 0.5 |
| ANGPT2 | −2.1 ± 0.3 |
| KISS1 | −2.5 ± 0.4 |
| ANTXR1 | −2.8 ± 0.4 |
| CLDN11 | −10.0 ± 0.9 |
Overexpression of the CTAG2 cancer/testis antigen in a panel of infantile hemangioma tumors
In our microarray analysis, the cancer/testis antigen CTAG2 displayed the highest upregulation of mRNA expression in HEMECs compared to the HDMECs. This gene, whose function is completely unknown, has been shown to be significantly increased in several metastatic cancers, and is actively being researched as a target of immune therapy for aggressive cancers [23–29]. If CTAG2 is preferentially upregulated in infantile hemangiomas, it is possible that treatment of disfiguring or life threatening infantile hemangioma tumors could employ immune therapy against this antigen. Furthermore, CTAG2 is reported to be a target for antigen-specific T-cells in patients with various metastatic tumors [29, 30]. A recent study has shown that nearly half of the patients with spontaneous CTAG2-specific CD4(+) T cell responses had circulating CTAG2-specific antibodies that recognized epitopes located in the C-terminal portion of CTAG2 [30]. As involution of infantile hemangiomas is believed to be due in part to an immune mediated attack on the tumor itself [4], it is possible that T-cell targeting of the overexpressed CTAG2 protein could contribute to this process. We confirmed our microarray data at the protein level by performing immunohistochemistry on a panel of 16 paraffin embedded infantile hemangioma tumors representing both the proliferating and involuting stages of the disease and 4 normal neonatal dermal tissues. A limited amount of CTAG2 expression was observed in the normal dermal tissues (a few nerve cells and bundles present staining, whereas the fibroblasts and collagen fibers are negative), and despite this gene being coined a “cancer/testis specific antigen”, analysis of publically available microarray datasets suggests this gene is expressed at a low level across a large number of tissues (http://www.biogps.org) and it has been reported in the literature to be expressed in the placenta and ovary [31]. In proliferating tumors (composed of densely proliferating endothelial cells), we observed intense CTAG2 staining in the endothelial cells for all sections analyzed (Figure 2). In contrast, involuting tumors (marked by substantial adipocyte deposits—a characteristic of the later stages in the development of this tumor [32]) exhibited significantly reduced levels of CTAG2 staining. As Calicchio et al. did not detect significant differences in CTAG2 expression between microdissected endothelial cells from proliferating and involuting infantile hemangiomas and the staining intensity of individual blood vessels appears relatively constant between proliferating and involuting hemangiomas, we suspect that the reduced CTAG2 staining in involuting tumors is most likely due to reductions in tumor vascular density but not changes in gene transcription.
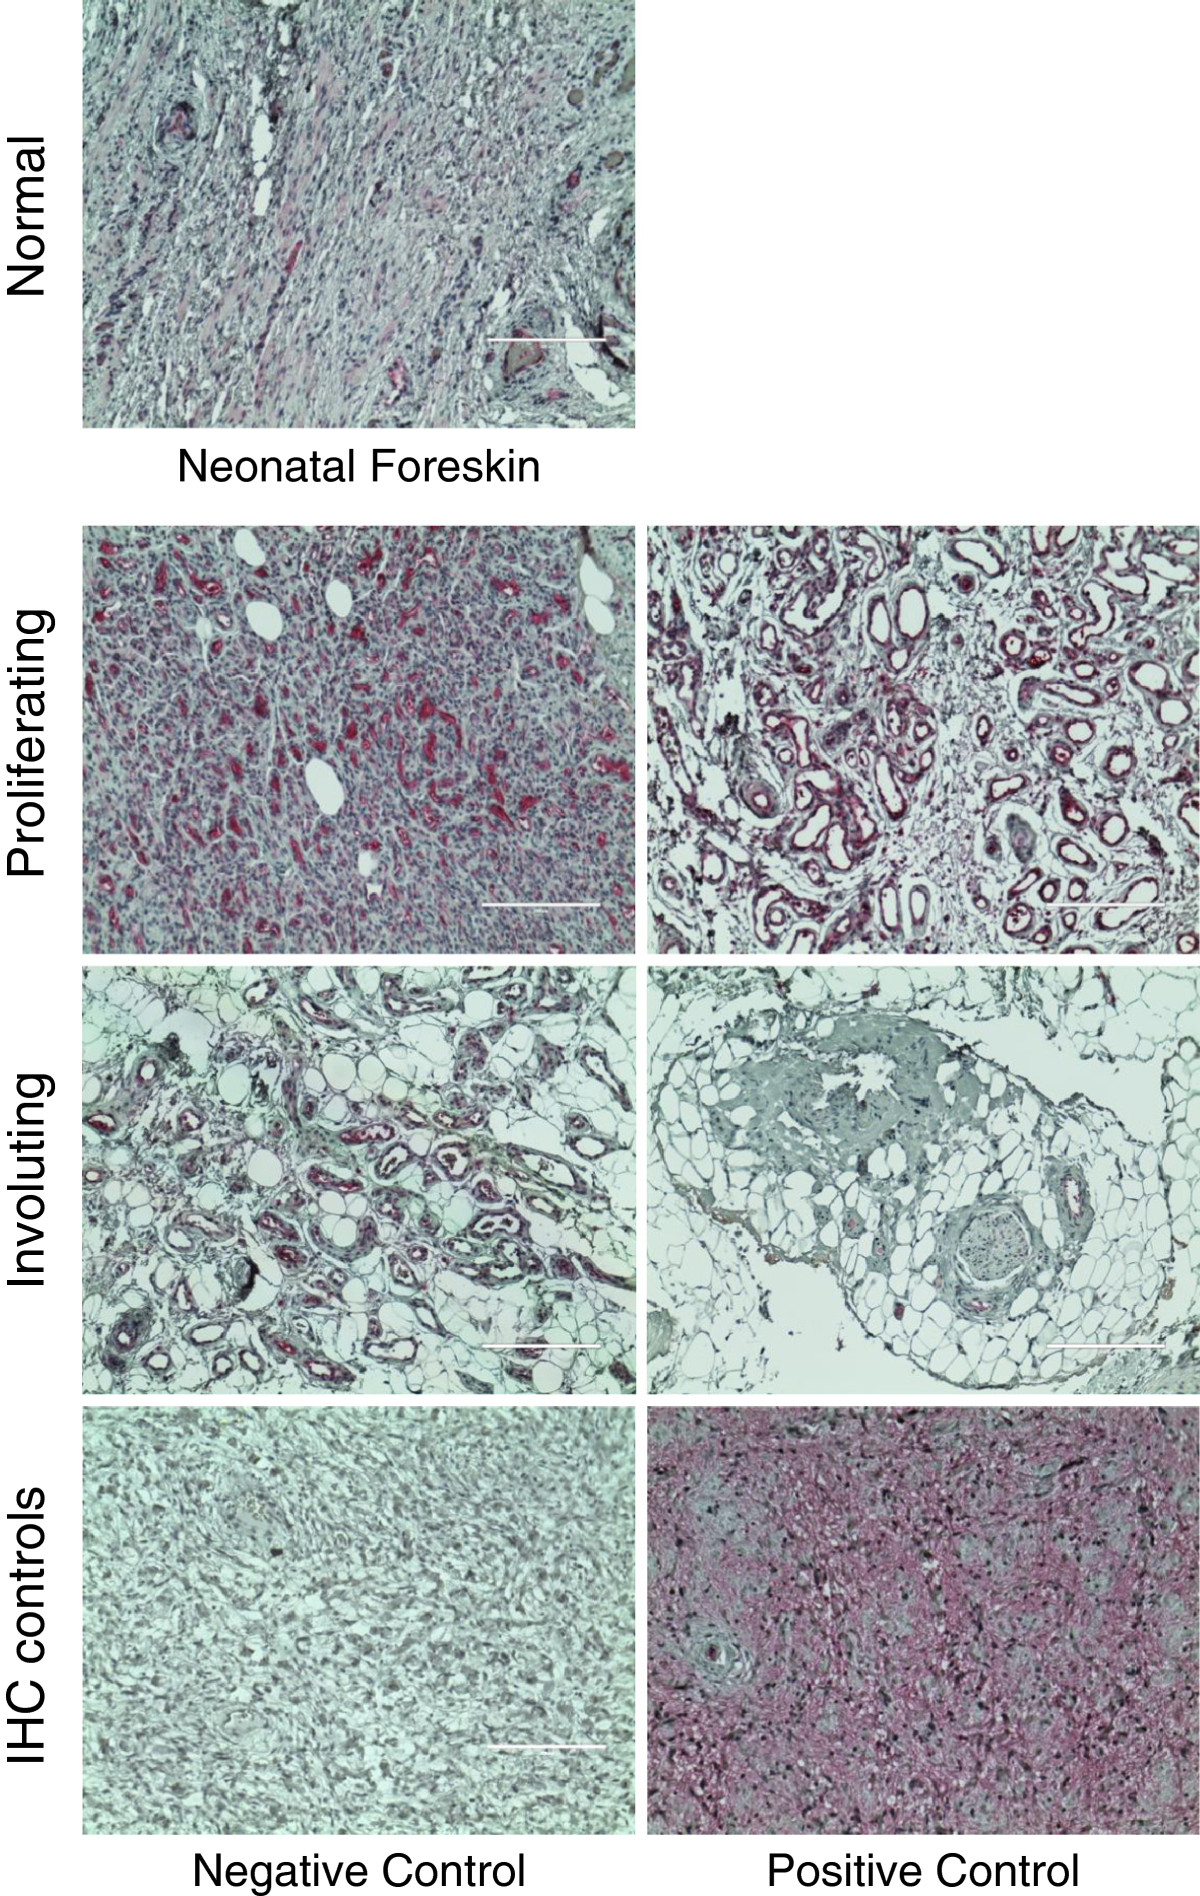
Figure 2
Figure 2 caption
Detection of CTAG2 protein levels in infantile hemangioma tissues. Proliferating and involuting infantile hemangioma tissues as well as normal neonatal foreskin tissues were cut from paraffin blocks, incubated with antibodies against CTAG2, and detected using alkaline phosphatase staining (). Immunohistochemistry () controls included incubations without CTAG2 antibody () and with CTAG2 antibody () in thin sections from metastatic breast cancer. All images were obtained at 100X total magnification.
Conclusion
Our data indicate that global transcriptional expression patterns are markedly unique between pure cultures of HDMVECs and HEMECs with major alterations in cell cycle, adhesion, and arachidonic acid metabolism genes. Though considered benign, HEMECs showed surprising aberrant regulation in the expression of several genes involved in tumor progression. Our finding that CTAG2 is highly expressed in infantile hemangiomas may lead to the development of immune-mediated therapies against infantile hemangiomas.
Authors’ original submitted files for images
Below are the links to the authors’ original submitted files for images.
Authors’ original file for figure 1
Authors’ original file for figure 2
References
- GLUT1: a newly discovered immunohistochemical marker for juvenile hemangiomas. Hum Pathol. 2000;31:11-22.
- Hypothesis: the metastatic niche theory can elucidate infantile hemangioma development. J Cutan Pathol. 2010;37(Suppl 1):83-87.
- Evidence by molecular profiling for a placental origin of infantile hemangioma. Proc Natl Acad Sci USA. 2005;102:19097-19102.
- Identifying potential regulators of infantile hemangioma progression through large-scale expression analysis: a possible role for the immune system and indoleamine 2,3 dioxygenase (IDO) during involution. Lymphat Res Biol. 2003;1:291-299.
- Identification of signaling systems in proliferating and involuting phase infantile hemangiomas by genome-wide transcriptional profiling. Am J Pathol. 2009;174:1638-1649.
- Clonality and altered behavior of endothelial cells from hemangiomas. J Clin Invest. 2001;107:745-752.
- Propranolol treatment of infantile hemangioma endothelial cells: A molecular analysis. Exp Ther Med. 2012;4:594-604.
- Endothelial progenitor cells from infantile hemangioma and umbilical cord blood display unique cellular responses to endostatin. Blood. 2006;108:915-921.
- Vascular pharmacology of epoxyeicosatrienoic acids. Adv Pharmacol. 2010;60:27-59.
- Angiopoietins in angiogenesis. Cancer Lett. 2013;328:18-26.
- Selective blockade of tumor angiogenesis. Cell Cycle. 2012;11:2253-2259.
- Regulator of G-protein signaling 5 (RGS5) protein: a novel marker of cancer vasculature elicited and sustained by the tumor's proangiogenic microenvironment. Cell Mol Life Sci. 2012;69:1167-1178.
- The SWI/SNF chromatin remodeling subunit BAF57 is a critical regulator of estrogen receptor function in breast cancer cells. J Biol Chem. 2006;281:22656-22664.
- LAGE-1, a new gene with tumor specificity. Int J Cancer. 1998;76:903-908.
- Transcriptional profiling of human cavernosal endothelial cells reveals distinctive cell adhesion phenotype and role for claudin 11 in vascular barrier function. Physiol Genomics. 2009;39:100-108.
- Kisspeptin-10, a KISS1-derived decapeptide, inhibits tumor angiogenesis by suppressing Sp1-mediated VEGF expression and FAK/Rho GTPase activation. Cancer Res. 2009;69:7062-7070.
- Transcriptional regulation of KiSS-1 gene expression in metastatic melanoma by specificity protein-1 and its coactivator DRIP-130. Oncogene. 2007;26:1739-1747.
- Suppressed NFAT-dependent VEGFR1 expression and constitutive VEGFR2 signaling in infantile hemangioma. Nat Med. 2008;14:1236-1246.
- Increased Tie2 expression, enhanced response to angiopoietin-1, and dysregulated angiopoietin-2 expression in hemangioma-derived endothelial cells. Am J Pathol. 2001;159:2271-2280.
- Endogenous endothelial cell signaling systems maintain vascular stability. Angiogenesis. 2009;12:149-158.
- Kisspeptin-10 inhibits angiogenesis in human placental vessels ex vivo and endothelial cells in vitro. Endocrinology. 2010;151:5927-5934.
- Regulation of KiSS-1 metastasis suppressor gene expression in breast cancer cells by direct interaction of transcription factors activator protein-2alpha and specificity protein-1. J Biol Chem. 2006;281:51-58.
- NY-ESO-1 and LAGE-1 cancer-testis antigens are potential targets for immunotherapy in epithelial ovarian cancer. Cancer Res. 2003;63:6076-6083.
- Dominant B cell epitope from NY-ESO-1 recognized by sera from a wide spectrum of cancer patients: implications as a potential biomarker. Int J Cancer. 2005;114:268-273.
- A new specific gene expression in squamous cell carcinoma of the esophagus detected using representational difference analysis and cDNA microarray. Oncology. 2006;70:25-33.
- Identification and expression analysis of novel LAGE-1 alleles with single nucleotide polymorphisms in cancer patients. J Cancer Res Clin Oncol. 2008;134:495-502.
- Prognostic impact of cancer/testis antigen expression in advanced stage multiple myeloma patients. Cancer Immun. 2008;8:2-.
- Comparisons for detecting NY-ESO-1 mRNA expression levels in hepatocellular carcinoma tissues. Oncol Rep. 2009;21:713-719.
- NYESO-1/LAGE-1s and PRAME are targets for antigen specific T cells in chondrosarcoma following treatment with 5-Aza-2-deoxycitabine. PLoS One. 2012;7:e32165-.
- Epitope hierarchy of spontaneous CD4+ T cell responses to LAGE-1. J Immunol. 2011;186:312-322.
- Cancer/testis antigens and gametogenesis: a review and "brain-storming" session. Cancer Cell Int. 2005;5:4-.
- Evolution of hemangioma endothelium. Exp Mol Pathol. 2012;93:264-272.

The present article has been published in Vascular Cell journal by Publiverse Online S.R.L.