Notch and VEGF pathways play distinct but complementary roles in tumor angiogenesis
Vascular Cell. 2013;
Received: 3 May 2013 | Accepted: 20 September 2013 | Published: 25 September 2013
Vascular Cell ISSN: 2045-824X
Abstract
Background
Anti-angiogenesis is a validated strategy to treat cancer, with efficacy in controlling both primary tumor growth and metastasis. The role of the Notch family of proteins in tumor angiogenesis is still emerging, but recent data suggest that Notch signaling may function in the physiologic response to loss of VEGF signaling, and thus participate in tumor adaptation to VEGF inhibitors.
Methods
We asked whether combining Notch and VEGF blockade would enhance suppression of tumor angiogenesis and growth, using the NGP neuroblastoma model. NGP tumors were engineered to express a Notch1 decoy construct, which restricts Notch signaling, and then treated with either the anti-VEGF antibody bevacizumab or vehicle.
Results
Combining Notch and VEGF blockade led to blood vessel regression, increasing endothelial cell apoptosis and disrupting pericyte coverage of endothelial cells. Combined Notch and VEGF blockade did not affect tumor weight, but did additively reduce tumor viability.
Conclusions
Our results indicate that Notch and VEGF pathways play distinct but complementary roles in tumor angiogenesis, and show that concurrent blockade disrupts primary tumor vasculature and viability further than inhibition of either pathway alone.
Keywords
Neuroblastoma Vascular endothelial growth factor Notch Angiogenesis BevacizumabBackground
The anti-vascular endothelial growth factor (VEGF) antibody bevacizumab (BV) is clinically validated to treat human cancers in adults, and is currently being evaluated as a therapy for pediatric tumors, including neuroblastoma [1]. However, it appears that essentially all patients, even those who respond to BV initially, will ultimately progress despite ongoing treatment. Thus, a similar limitation is anticipated in children treated with this agent. The mechanisms of tumor progression during BV treatment are not well understood.
We have previously shown that VEGF inhibition disrupts the blood vessels of the neuroblastoma NGP xenograft model, but resistance occurs [2–4]. VEGF blockade can increase cooption of existing vascular structures by encroaching tumors [2], a mechanism which may partly compensate for defective VEGF signaling. An additional mechanism for tumor progression during VEGF blockade could be the activation of an alternative angiogenic pathway. In support of this concept, we have shown that the Notch pathway is up-regulated in neuroblastoma when the VEGF receptor 2 (VEGFR2) is blocked with the anti-VEGFR2 antibody DC101 [3].
To examine the role of Notch in tumor angiogenesis, we have used the Notch1 decoy (N1D), a soluble construct derived from the extracellular domain of the Notch1 receptor that blocks Notch activation by sequestering Notch ligands [5]. Notch blockade using the N1D disrupts tumor vasculature and decreases tumor viability [5]. Based on our previous studies, we thus hypothesized that blocking the Notch and VEGF pathways simultaneously would disrupt the vasculature and inhibit tumor growth more effectively than either agent alone. To test this hypothesis, we evaluated the effects of expressing N1D in combination with bevacizumab (BV) in the NGP neuroblastoma xenograft model. Here, we report that combining N1D with BV had a profound effect on the tumor viability and the vasculature of NGP xenografts. N1D and BV additively increased tumor endothelial cell apoptosis, leading to blood vessel regression, and cell death.
Methods
Transfections and cell culture
NGP-LacZ and NGP-N1D cells were maintained as described [5]. pLKO.1 empty vector (control) and pLKO.1 Notch1 shRNA (Notch1 KD) plasmids (Sigma Aldrich) were stably transfected into NGP cells, selected and maintained in 1 mg/ml puromycin (Sigma Aldrich).
NGP xenograft model
1 × 10⁶ cells were injected intrarenally into 4–6 week old NCR female nude mice (Taconic, Germantown, NY) as previously described [3]. All animal experiments were approved by the Columbia University Institutional Animal Care and Use Committee. At sacrifice, organs were harvested and weighed as previously described [3].
Bevacizumab and placebo administration
NGP-LacZ and NGP-Notch1 decoy (N1D) tumor-bearing mice were randomized one week after implantation. At this time, 28 mice in each group were treated with 100 μg mouse albumin (Sigma Aldrich) (placebo), and another 28 with 250 μg bevacizumab (10 mg/kg BV, Genentech) by intraperitoneal injection biweekly until time of sacrifice. Both the N1D and BV are fused to a human Fc fragment. Immunohistochemistry (Additional file 1: Figure S1A) and SDS-PAGE (Additional file 1: Figure S1B) to human Fc was performed on tumors, and confirmed expression of N1D in the tumors at time of sacrifice. Since BV is also fused to human Fc, it could also be detected in the NGP-LacZ + BV and NGP-N1D + BV tumors by SDS-PAGE (Additional file 1: Figure S1B, lower band).
Reagents
Primary antibodies: αSMA (Lab vision), cleaved Notch1 (Cell Signaling), PECAM-1 (Angioproteomie), Notch1 (Upstate), collagen IV (Cosmobio), biotinylated hFc (Jackson Labs). Alexafluor probes (Invitrogen) were used for fluorescent stains.
Hypoxyprobe and quantification
Thirty minutes prior to sacrifice, mice received an intraperitoneal injection of 0.1 ml of pimonidazole (Hypoxyprobe®, Chemicon), and paraffin sections were used to stain for pimonidazole with MAB-1 (Chemicon), following the manufacturer’s instructions. Four tumors per treatment group were quantified, with an average of 10 images taken from each tumor section at 20×. The images were then analyzed using Adobe Photoshop using an arbitrary threshold applied to all images.
Lectin perfusion and quantification
An intracardiac injection of 100 μl of Fluorescein labeled
TUNEL assay quantification
TUNEL staining and quantification was performed as described [5]. An average of 20 images from each tumor section, and 5 tumors per group were analyzed.
Collagen IV, PECAM-1 and EC apoptosis quantifications
Fresh-frozen, serial sections were used for Collagen IV, PECAM-1 and EC apoptosis quantifications. Viable tumor areas immunostained for collagen IV or PECAM-1 were photographed at 10× (Collagen IV) or 20× (PECAM-1). An average of 15 (Collagen IV) or 30 (PECAM-1) images per tumor, and three tumors per group were analyzed. For EC quantification, TUNEL, PECAM-1, stained sections were mounted with DAPI (Vector) and images obtained at 40× magnification.
Cooption quantification
5 μm sections of paraffin-embedded livers or kidneys were stained with hematoxylin and eosin (H&E). Tumor sections were scanned using an Epson 4870 Scanner. Glomeruli surrounded by at least one layer of tumor cells were counted as coopted vasculature. One section per tumor, and 28–30 tumors per group were analyzed.
VEGF ELISA
3 × 10⁶ NGP-LacZ or NGP-N1D cells were plated on a 10 cm dish, and cultured in 6 ml of serum-free EBM-2 (Invitrogen) for 48 hrs. Supernatant from three independent collections was measured, using a human VEGF ELISA kit (R&D) following the manufacturer’s instructions.
HUVEC cell death and BrdU incorporation assays
8,000 HUVEC per well (48 well plate) were seeded on a fibrinogen gel (Sigma), in basal EBM-2 media (Lonza). Two hrs later, media was replaced by conditioned media (CM) from NGP-LacZ or NGP-N1D cells (3×10⁶ cells per 10 cm2 plate, cultured for 24 hrs in EBM-2 basal media. We added 50 ng/ml BV or 20 ng/ml rhVEGF165 (R&D) to the CM. For BrdU assays, 2 μl BrdU (Millipore) was added per ml of CM. Cell death assays (Roche) or BrdU incorporation assays (Millipore) were measured 23 hrs later, following the manufacturer’s instructions.
Immunoprecipitation and Western Blots
Tumors were lysed in a ratio of 100 ml of lysis buffer to 10 mg of tumor. 100 μl of tumor lysate was immunoprecipitated with A/G agarose beads (Santa Cruz Biotechnology) and blotted with anti-human Fc (Pierce).
Reverse transcription and quantitative PCR
RNA was extracted from cells following the manufacturer’s instructions (Qiagen). Tissue RNA extraction was performed with Ambion ToTALLY RNA kit (Ambion) following the manufacturer’s specifications. RNA from tissue or cells was reverse transcribed following the manufacturer’s instructions (Invitrogen, DNAseI and Superscript). Quantitative PCR was performed with the Taqman system (Applied Biosystems) following the manufacturer’s specifications, using primers designed not to amplify genomic DNA. GeNorm was used to select the normalization values out of 6 housekeeping genes.
Microarrays and probes preparation
HG-U133A 2.0 (human genome) Gene Chips (Affymetrix, Santa Clara, CA) were used to investigate gene expression in xenograft tumors. The cRNA probes were synthesized as recommended by Affymetrix, purified using RNeasy and fragmented according to the Affymetrix protocol, and 15 μg of biotinylated cRNA were hybridized to the microarrays. The samples were scanned with Affymetrix Gene Chip Scanner 3000. The data set, corresponding to 24 tumors (6 arrays per group), has been deposited in NCBI’s Gene Expression Omnibus (GEO) and is available through accession number GSE (pending). Data were RMA normalized using the Bioconductor open source software.
Results
Combined blockade of notch and VEGF increases necrosis and apoptosis in primary tumors
We have previously shown that inhibiting Notch signaling with the soluble Notch1 decoy (N1D) decreased viability (but not tumor weight), disrupted vasculature, disorganized the interaction of endothelial cells with pericytes in neuroblastoma NGP xenografts [5]. Given the critical role of VEGF in tumor angiogenesis, we hypothesized that combining Notch inhibition with VEGF blockade would synergistically inhibit tumor growth and angiogenesis. NGP-N1D cells or control NGP-LacZ cells were implanted into the left kidney of athymic mice. The mice were then randomized to treatment with either placebo or BV, and sacrificed at 5.5 weeks. Consistent with our previous data [5], there was no difference in tumor weight between control NGP-LacZ and NGP-N1D (Figure 1A). VEGF blockade with BV, however, reduced NGP mean tumor weight by 61% (p < 0.001) compared to NGP-LacZ. Combined treatment with N1D and BV (NGP-N1D + BV), reduced mean tumor weight by a similar extent, 60%, as compared to NGP-LacZ, (p < 0.001).
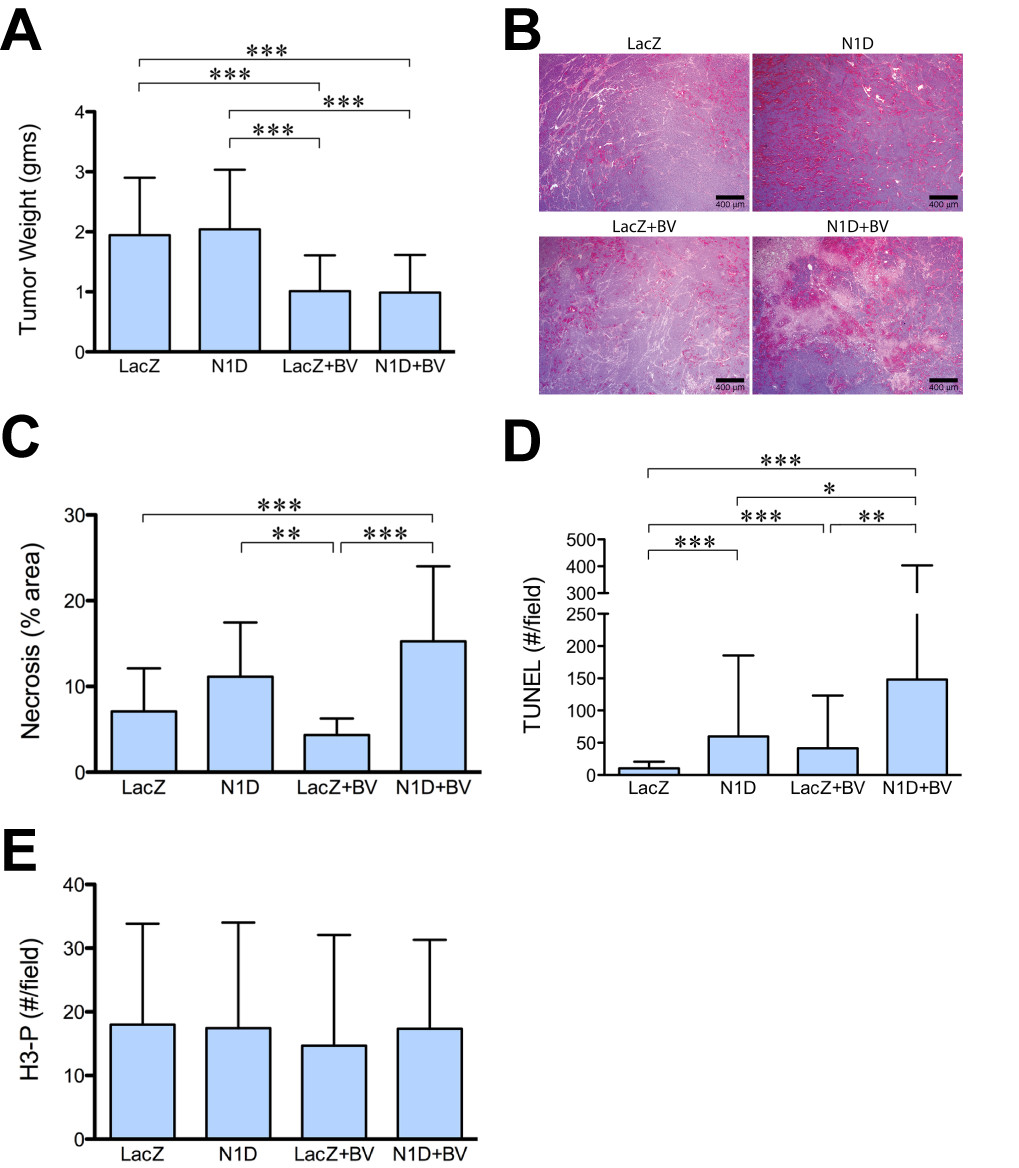
Figure 1
Figure 1 caption
Combined Notch and VEGF increases tumor necrosis and apoptosis. (A) NGP-N1D tumors did not have different tumor weights than NGP-LacZ controls. BV treatment reduced tumor weights compared to controls and NGP-Notch1 decoy. Combining Notch1 decoy with BV reduced tumor weights compared to NGP-LacZ controls and NGP-N1D Error bars represent SD. ***P < 0.001. (B) NGP-N1D + BV tumors had increased necrosis as seen by H&E. Bar = 400 μm. (C) Quantification of necrosis showed NGP-N1D + BV with increased necrosis. Error bars represent SD. **P < 0.01, ***P < 0.001. (D) NGP-N1D and NGP-LacZ + BV tumors had increased numbers of TUNEL positive counts per field compared to NGP-LacZ controls. An additive increase was observed in NGP-N1D + BV tumors (p < 0.001). Error bars represent SD. *P < 0.05, **P < 0.01, ***P < 0.001. (E) Proliferation in tumors was assessed by phosphorylated-Histone H3 (H3-P) IHC. There was no significant difference in proliferation. Error bars represent SD. P = n.s.
Although there was no difference in tumor weight as compared with BV treatment alone, the NGP-N1D + BV tumors were noticeably more necrotic (Figure 1B), which was confirmed by quantification of necrosis in H&E sections (Figure 1C). Trichrome staining confirmed that these differences were due to necrosis and not fibrosis (data not shown). When assessed by TUNEL, the NGP-N1D + BV tumors exhibited significantly more apoptosis then NGP-LacZ controls (14.4 fold), BV alone (3.6 fold), or N1D alone (2.5 fold) (Figure 1D). Blockade of Notch or VEGF did not have a direct effect on tumor cell proliferation, as there was no difference in phospho-histone H3 positive cells in areas of viable tumor (Figure 1E). These data indicate that combined Notch and VEGF blockade additively decreases tumor viability.
Combined blockade of notch and VEGF markedly decreases perfusion
We next evaluated the effect of Notch and VEGF blockade on lectin perfusion (Figure 2A,B). We found that with combined blockade (NGP-N1D + BV), there was a paucity of vessels, with a significantly reduced (P < 0.05) lectin-positive area (16% of control NGP-LacZ, Figure 2B). Blockade with N1D or BV alone did not reduce overall perfusion as measured by lectin-positive area (Figure 2B). However, in the case of BV, bound lectin outlined predominantly larger vessels (Figure 2A, arrow), or coopted renal glomeruli (Figure 2A, arrowhead), which contribute disproportionally to the total lectin-positive area. There was a marked reduction in vessel branching when VEGF was blocked (Figure 2C), either with BV alone (12%) or with N1D + BV (7%), indicating that VEGF blockade inhibits the small sprouts that initiate neoangiogenesis.
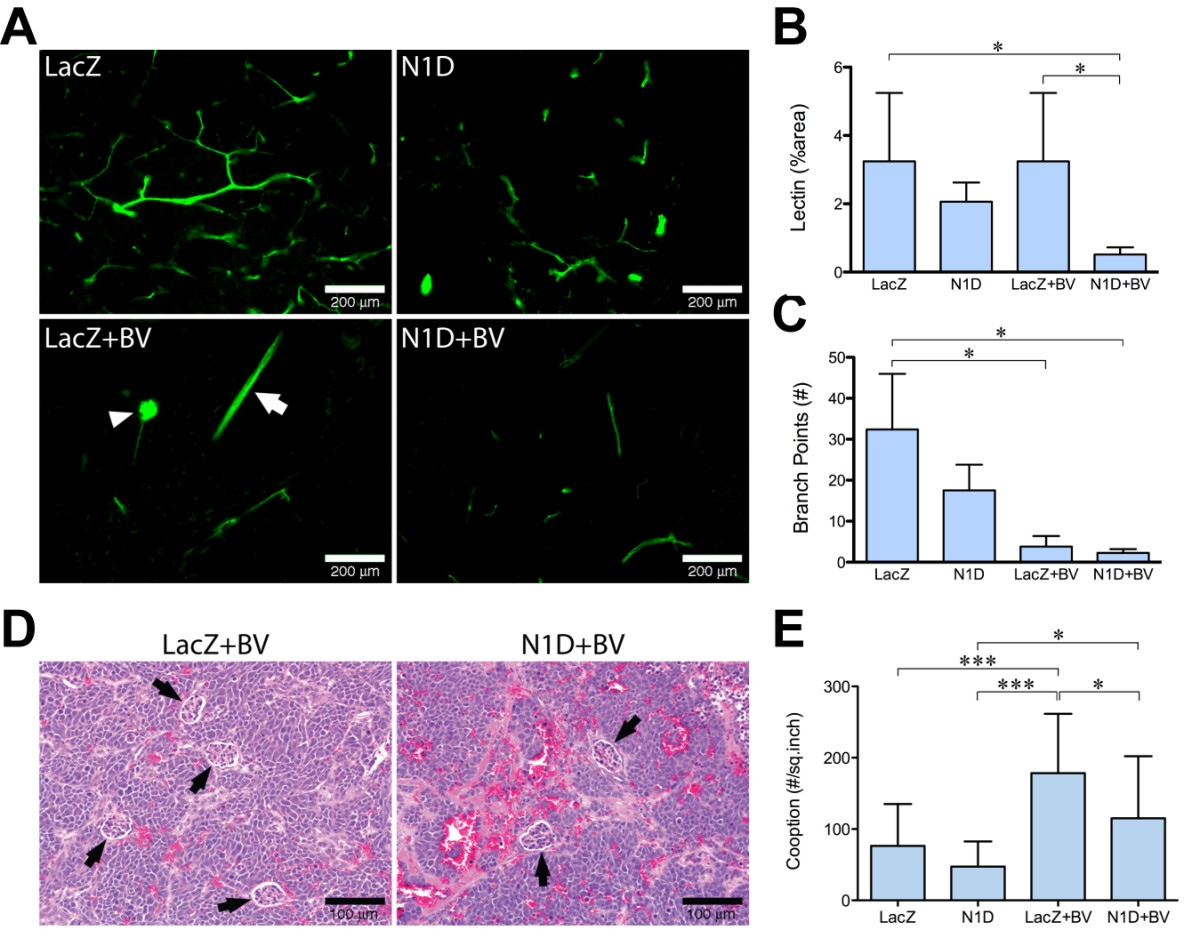
Figure 2
Figure 2 caption
Combined Notch and VEGF blockade decreases perfusion and branching. (A) Lectin perfusion showed marked reduction in perfusion in NGP-N1D + BV. Bar = 200 μm. (B) Lectin perfusion showed marked reduction in perfusion in NGP-N1D + BV. Error bars represent SD. *P < 0.05. (C) Marked decrease in branches in NGP-LacZ + BV and NGP-N1D + BV. Error bars represent SD. *P < 0.05. (D) Representative H&E of NGP-LacZ + BV and NGP-N1D + BV tumors with coopted glomeruli (black arrowheads). Bar = 100 μm. (E) Compared to NGP-LacZ controls, NGP-LacZ + BV tumors had a higher number of coopted glomeruli per square inch. NGP-N1D tumors were not different from NGP-LacZ controls. NGP-N1D + BV tumors had less coopted glomeruli than NGP-LacZ + BV tumors. Error bars represent SD. *P < 0.05, ***P < 0.001.
The decrease in lectin-positive area for NGP-N1D + BV relative to NGP-BV tumors suggested that there could be a decrease in the number of coopted glomeruli. We quantified coopted vessels by counting the number of glomeruli surrounded by tumor cells in H&E sections (Figure 2D, arrows). The number of coopted glomeruli in NGP-LacZ + BV tumors was increased 2.3 fold compared to NGP-LacZ tumors (Figure 2E). Notch blockade significantly attenuated this BV-induced increase in cooption, with NGP-N1D + BV tumors having significantly fewer coopted glomeruli as compared to the NGP-LacZ + BV group (115 vs 178, respectively, Figure 2E). These findings suggest that Notch blockade attenuates BV-induced cooption in NGP xenografts. Furthermore, immunostaining for cleaved Notch1, reflecting processing of the Notch receptor after ligand binding, showed increased activated Notch1 in coopted glomeruli as a result of BV treatment in NGP tumors (Additional file 2: Figure S2). These data implicate Notch signaling in BV-induced cooption of host vasculature.
Blockade of VEGF results in tumor hypoxia
The lectin perfusion results demonstrate that combined Notch and VEGF blockade reduces both neoangiogenesis and VEGF blockade-induced vascular cooption. To determine if this resulted in increased hypoxia, we quantified pimonidazole (Hypoxyprobe®) by IHC. There was significantly more hypoxia in NGP-LacZ + BV (P < 0.05) and NGP-N1D + BV (P < 0.001) as compared to NGP-LacZ. (Figure 3A,B). NGP-N1D was not significantly different from NGP-LacZ tumors.
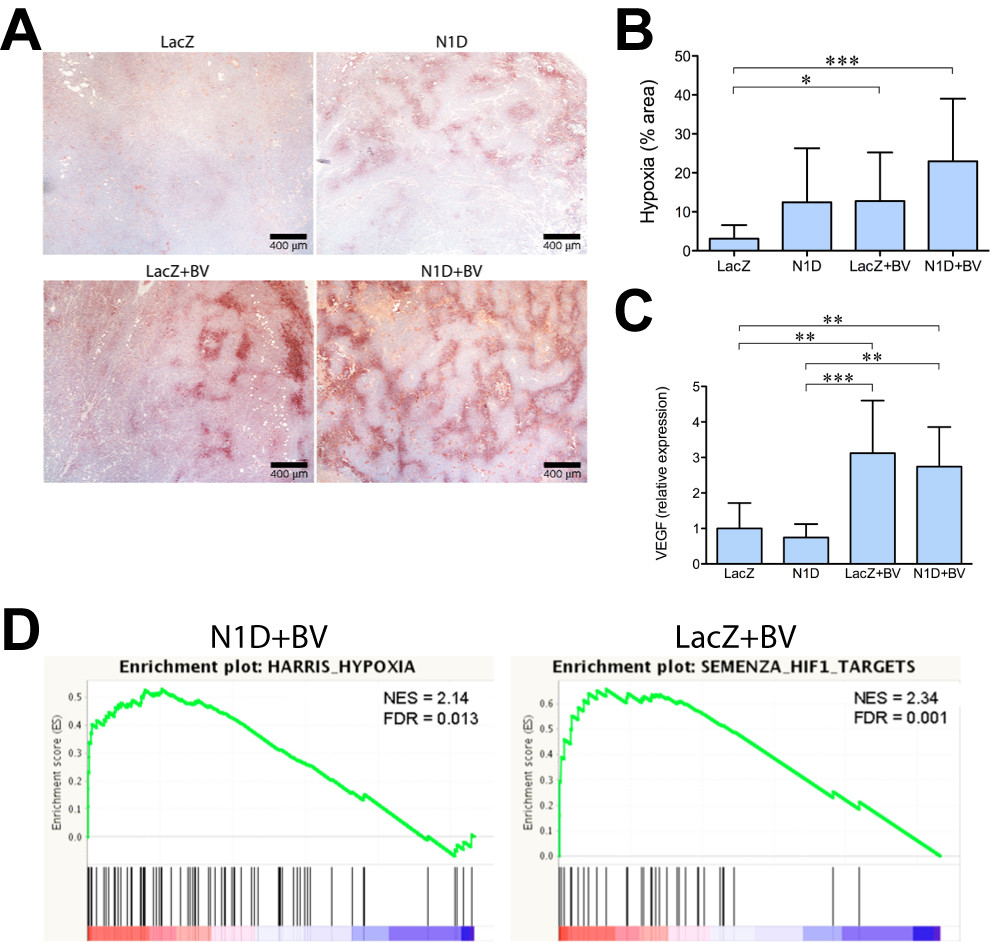
Figure 3
Figure 3 caption
Blockade of VEGF increases tumor hypoxia. (A) Immunostaining for pimonidazole hypoxyprobe shows that NGP-LacZ controls (top left) show almost no detectable staining. Both NGP-N1D and NGP-LacZ + BV (top right and bottom left) show increased areas of Hypoxyprobe in some areas of the tumor, but wide areas remained well oxygenated. NGP-N1D + BV tumors (bottom right) show Hypoxyprobe staining throughout the tumor. Bar = 400 μm. (B) Quantification of Hypoxyprobe staining showed increased the hypoxia of NGP-LacZ + BV and NGP-N1D + BV compared to NGP-LacZ controls. Error bars represent SD. *P < 0.05, **P < 0.001. (C) expression was increased in NGP-LacZ + BV and NGP-N1D + BV compared to NGP-LacZ or NGP-N1D. Error bars represent SD. **P < 0.01, ***P < 0.001. (D) GSEA enrichment plots are shown for HARRIS_HYPOXIA gene set NGP-N1D + BV vs NGP-LacZ, and for SEMENZA_HIF1_TARGETS NGP-LacZ + BV vs NGP-LacZ. Normalized Enrichment Score (NES) and False discovery rated (FDR) q-values are shown.
We also quantified the expression of two hypoxia responsive genes,
We further analyzed the tumors by gene expression profiling using HG-U133A 2.0 (human genome) Gene Chips (Affymetrix).
Table 1
| ENRICHED GENE SETS FOR N1D+BV TUMORS | ENRICHED GENE SETS FOR LacZ+BV TUMORS | ||||||
| POSITIVELY ENRICHED GENE SETS | ES | NES | FDR q-val | POSITIVELY ENRICHED GENE SETS | ES | NES | FDR q-val |
| NAME | NAME | ||||||
| NIKOLSKY_BREAST_CANCER_17Q21_Q25_AMPLICON | 0.600 | 2.850 | 0.000 | XU_HGF_TARGETS_REPRESSED_BY_AKT1_DN | 0.570 | 2.420 | 0.001 |
| XU_HGF_TARGETS_REPRESSED_BY_AKT1_DN | 0.640 | 2.510 | 0.000 | ||||
| REACTOME_PHASE_1_FUNCTIONALIZATION | 0.810 | 2.260 | 0.005 | SEIDEN_ONCOGENESIS_BY_MET | 0.530 | 2.310 | 0.001 |
| KEGG_ANTIGEN_PROCESSING_AND_PRESENTATION | 0.530 | 2.300 | 0.001 | ||||
| KEGG_ANTIGEN_PROCESSING_AND_PRESENTATION | 0.540 | 2.220 | 0.005 | ||||
| CUI_TCF21_TARGETS_DN | 0.680 | 2.170 | 0.009 | PRAMOONJAGO_SOX4_TARGETS_UP | 0.580 | 2.260 | 0.002 |
| HELLER_SILENCED_BY_METHYLATION_DN | 0.480 | 2.160 | 0.011 | ||||
| NIKOLSKY_BREAST_CANCER_17Q11_Q21_AMPLICON | 0.550 | 2.130 | 0.012 | CUI_TCF21_TARGETS_DN | 0.660 | 2.140 | 0.013 |
| KEGG_DRUG_METABOLISM_CYTOCHROME_P450 | 0.560 | 2.120 | 0.014 | REACTOME_RNA_POLYMERASE_I_PROMOTER_OPENING | 0.560 | 2.140 | 0.011 |
| KEGG_GRAFT_VERSUS_HOST_DISEASE | 0.600 | 2.090 | 0.018 | LIU_COMMON_CANCER_GENES | 0.560 | 2.100 | 0.019 |
| DAZARD_RESPONSE_TO_UV_SCC_UP | 0.510 | 2.070 | 0.026 | KEGG_SYSTEMIC_LUPUS_ERYTHEMATOSUS | 0.460 | 2.080 | 0.022 |
| LANDIS_BREAST_CANCER_PROGRESSION_UP | 0.590 | 2.060 | 0.028 | ||||
| CHANNEL_REGULATOR_ACTIVITY | 0.660 | 2.030 | 0.038 | NOJIMA_SFRP2_TARGETS_UP | 0.610 | 2.070 | 0.023 |
| REACTOME_SYNTHESIS_OF_BILE_ACIDS_AND_BILE_SALTS | 0.840 | 2.030 | 0.036 | SPIRA_SMOKERS_LUNG_CANCER_DN | 0.680 | 2.040 | 0.033 |
| CYCLIC_NUCLEOTIDE_METABOLIC_PROCESS | 0.840 | 2.010 | 0.044 | RUNNE_GENDER_EFFECT_UP | 0.830 | 2.020 | 0.042 |
| SCHURINGA_STAT5A_TARGETS_UP | 0.900 | 2.010 | 0.042 | KEGG_LINOLEIC_ACID_METABOLISM | 0.590 | 2.010 | 0.046 |
| LU_TUMOR_ENDOTHELIAL_MARKERS_UP | 0.700 | 2.000 | 0.044 | NEBEN_AML_WITH_FLT3_OR_NRAS_DN | 0.740 | 2.000 | 0.046 |
| EXTRACELLULAR_LIGAND_GATED_ION_CHANNEL_ACTIVITY | 0.660 | 1.990 | 0.047 | LU_TUMOR_ENDOTHELIAL_MARKERS_UP | 0.650 | 2.000 | 0.044 |
| SEIDEN_ONCOGENESIS_BY_MET | 0.500 | 1.990 | 0.046 | NEGATIVELY ENRICHED GENE SETS | |||
| ELVIDGE_HIF1A_TARGETS_DN | NIKOLSKY_BREAST_CANCER_7P22_AMPLICON | -0.820 | -2.220 | 0.001 | |||
| NEGATIVELY ENRICHED GENE SETS | ENRICHED GENE SETS FOR N1D TUMORS | ||||||
| - | - | POSITIVELY ENRICHED GENE SETS | |||||
| VANHARANTA_UTERINE_FIBROID_UP | -0.650 | -2.180 | 0.003 | NAME | ES | NES | FDR q-val |
| - | - | NIKOLSKY_BREAST_CANCER_17Q11_Q21_AMPLICON | 0.640 | 2.290 | 0.002 | ||
| DACOSTA_ERCC3_ALLELE_XPCS_VS_TTD_UP | -0.710 | -2.050 | 0.026 | XU_HGF_TARGETS_REPRESSED_BY_AKT1_DN | 0.610 | 2.240 | 0.004 |
| NIKOLSKY_BREAST_CANCER_7P15_AMPLICON | -0.860 | -2.050 | 0.025 | LASTOWSKA_NEUROBLASTOMA_COPY_NUMBER_UP | 0.550 | 2.210 | 0.003 |
| GUENTHER_GROWTH_SPHERICAL_VS_ADHERENT_UP | -0.760 | -2.030 | 0.029 | KEGG_ANTIGEN_PROCESSING_AND_PRESENTATION | 0.560 | 2.140 | 0.009 |
| - | - | CHANNEL_REGULATOR_ACTIVITY | 0.720 | 2.080 | 0.020 | ||
| -‒0.580 | -‒1.980 | 0.048 | AUXILIARY_TRANSPORT_PROTEIN_ACTIVITY | 0.680 | 2.030 | 0.036 | |
| REACTOME_PHASE_1_FUNCTIONALIZATION | 0.760 | 2.010 | 0.041 | ||||
| NEGATIVELY ENRICHED GENE SETS | |||||||
| GUENTHER_GROWTH_SPHERICAL_VS_ADHERENT_UP | -0.850 | -2.160 | 0.010 | ||||
| MATTIOLI_MULTIPLE_MYELOMA_SUBGROUPS | -0.810 | -2.070 | 0.040 | ||||
| MCGARVEY_SILENCED_BY_METHYLATION_IN_COLON_CANCE | -0.680 | -2.040 | 0.042 | ||||
| SCHLESINGER_METHYLATED_DE_NOVO_IN_CANCER | -0.570 | -2.020 | 0.041 | ||||
Combined notch and VEGF blockade disrupts tumor vasculature
Combined blockade of VEGF and Notch reduced tumor viability, but did not further increase tumor hypoxia. To further understand the effect of combined blockade, we quantified tumor vasculature, using IHC for the basement membrane marker collagen IV, which forms a perivascular envelope that can persist after vascular regression. We detected a ~50% increase in collagen IV in NGP-LacZ + BV tumors as compared to both control NGP-LacZ and NGP-N1D + BV (Figure 4B), which suggested increased collagen IV contributed by coopted vasculature (Figure 4A, arrowheads). Notably, however, we noted persistent collagen IV in necrotic areas for NGP-N1D and for NGP-N1D + BV tumors (Figure 4A, areas denoted by “N” and delimited by dashed line). These results suggest that Notch blockade disrupts vasculature, with vascular regression marked by the collagen IV sleeves at sites of previously functioning vessels [7].
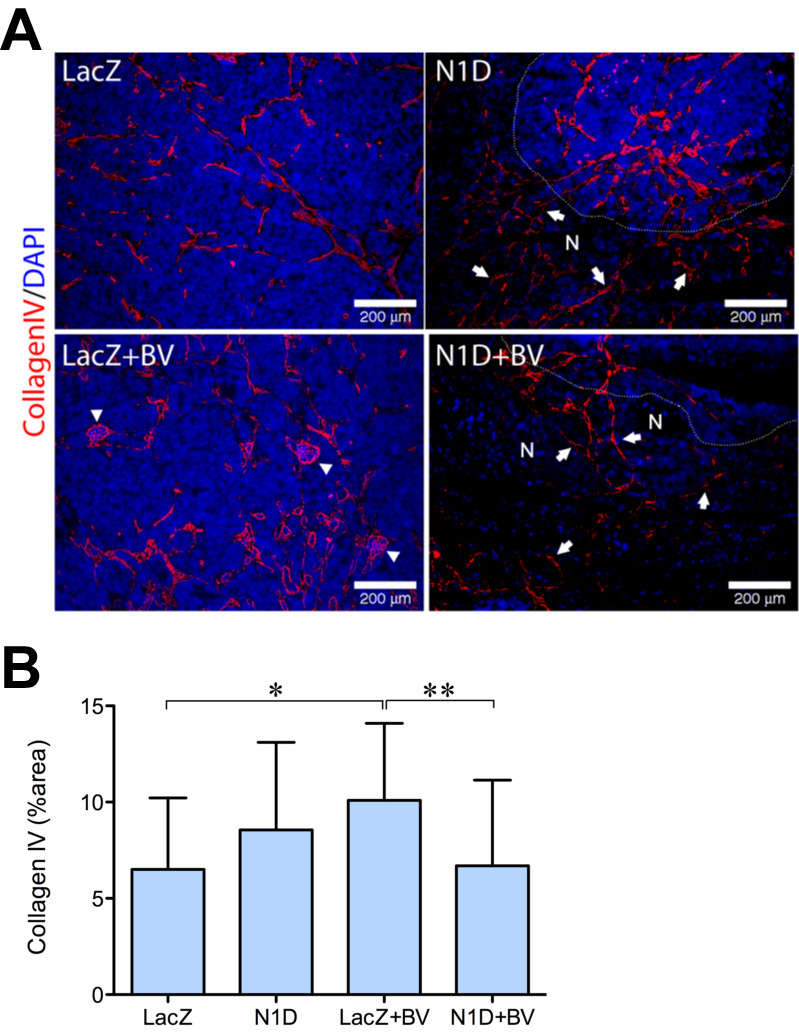
Figure 4
Figure 4 caption
Combined Notch and VEGF blockaded disrupts tumor vasculature. (A) Immunofluorescence staining for Collagen IV (red) demonstrated vasculature (arrows) in areas of necrosis (N) as indicated by absence of nuclei by DAPI (blue), for NGP-N1D and NGP-N1D + BV. For clarity, a white dotted line delineates border between viable and necrotic tumor areas. In NGP-LacZ + BV arrowheads indicate coopted glomeruli. Bar = 200 μm. (B) Collagen IV was quantified, with NGP-LacZ + BV significantly higher in comparison to NGP-LacZ and NGP-N1D + BV. Error bars represent SD. *P < 0.05, **P < 0.01.
Notch and VEGF blockade additively decrease survival of tumor endothelial cells
We assessed endothelial cells in vasculature by IHC for PECAM-1 (Figure 5A). Combined VEGF and Notch blockade significantly decreased PECAM-1 staining (Figure 5B), compared to NGP-LacZ (68%), NGP-N1D (46%), and NGP-LacZ + BV (56%). These results along with the decrease in branching seen in the lectin perfusion studies, suggest that combined inhibition with NGP-N1D + BV decreases endothelial sprouting and neoangiogenesis.
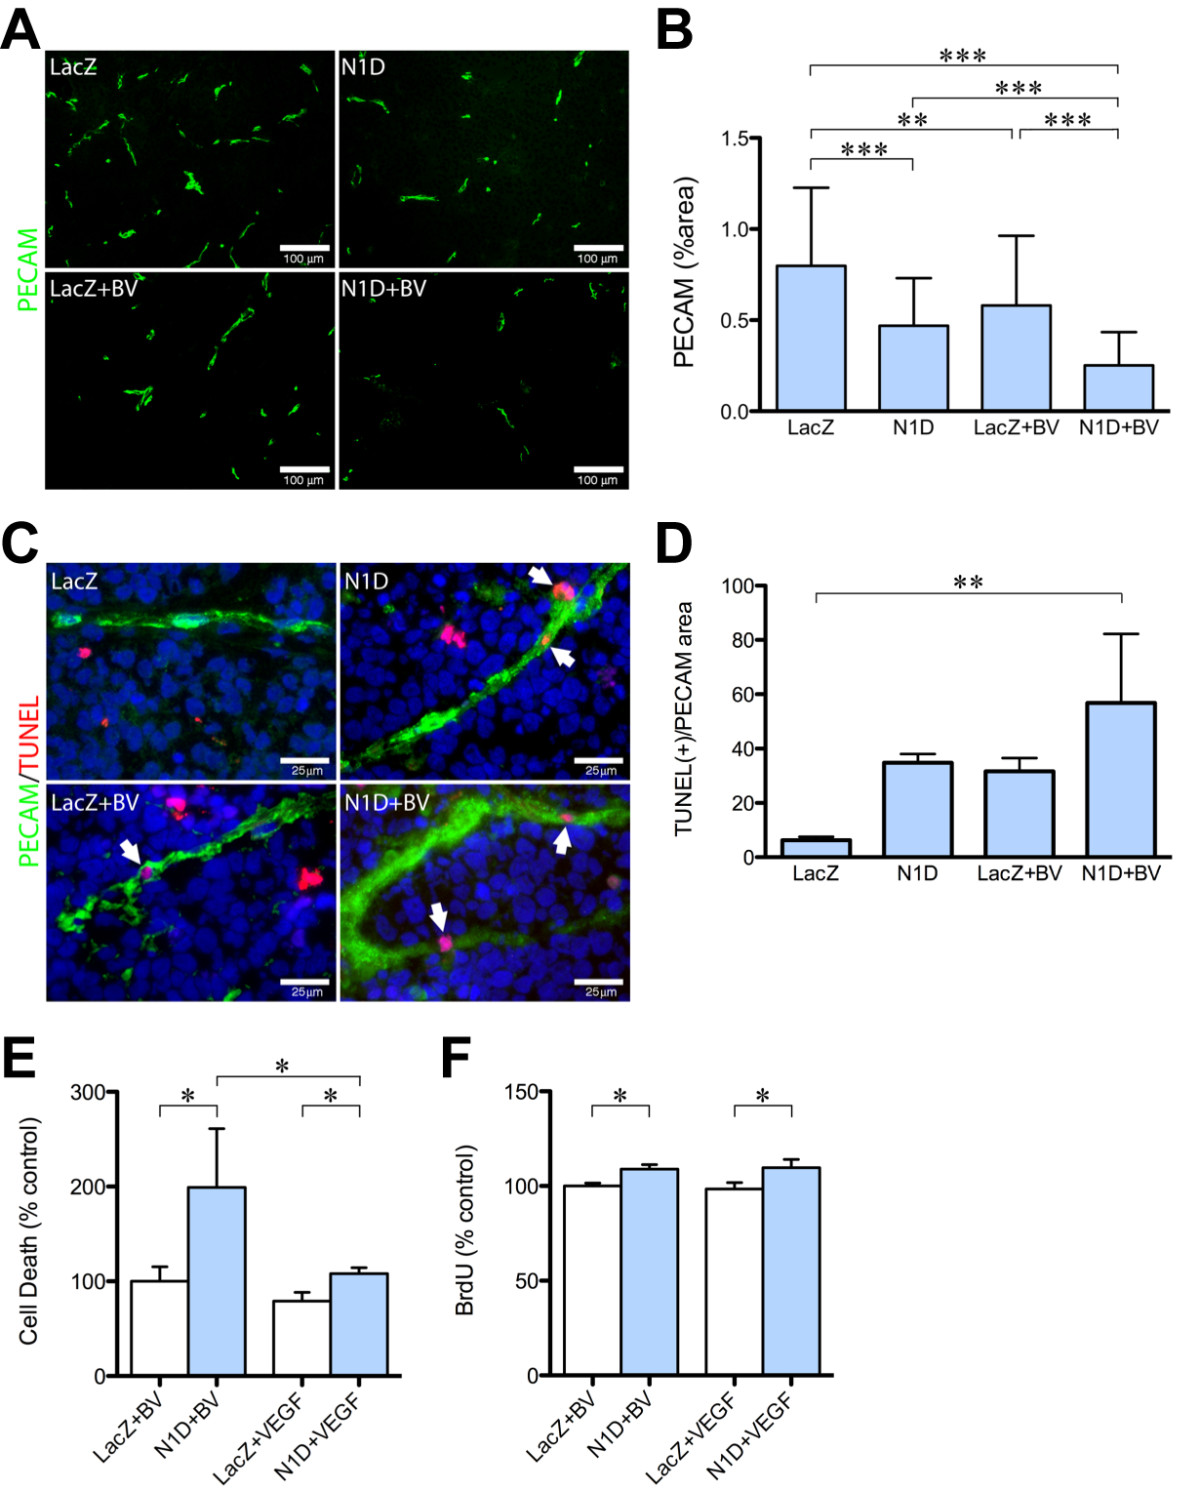
Figure 5
Figure 5 caption
Combined Notch and VEGF decreases endothelial cell coverage. (A) Representative pictures of PECAM-1 immunofluorescence (green) of NGP-LacZ controls (upper left), NGP-N1D (upper right), NGP-LacZ + BV (lower left), and NGP-N1D + BV (lower right). Bar = 100 μm. (B) Quantification of PECAM-1 immunofluorescence. NGP-N1D and NGP-LacZ + BV tumors had decreased PECAM-1 than NGP-LacZ controls. NGP-N1D + BV tumors had an additive decrease in PECAM-1. Error bars represent SD. **P < 0.01, ***P < 0.001. (C) Representative pictures of triple staining for TUNEL (red), PECAM-1 (green), DAPI (blue), white arrowheads. Bar = 25 μm (D) The number of DAPI(+), TUNEL(+) cells surrounded by PECAM-1 in each tumor normalized by the viable area shows increased apoptotic ECs in NGP-N1D + BV tumors. Error bars represent SD. **P < 0.01. (E) HUVECs incubated with N1D and BV had increased apoptosis compared to HUVECs with BV only. HUVECs incubated with N1D and VEGF had decreased apoptosis compared to N1D with BV, but were not different from HUVEC incubated with BV only. Consistent with the known role of VEGF promoting endothelial cell survival, HUVEC incubated with VEGF had lower apoptotic levels than HUVECs incubated with BV, and lower apoptotic levels than HUVECs incubated with N1D and VEGF. Error bars represent SD. *P < 0.05. (F) N1D with BV resulted in increased BrdU incorporation by HUVECs compared to BV only. Addition of VEGF did not affect N1D-induced proliferation. Error bars represent SD. *P < 0.05.
Previous studies have suggested that both Notch and VEGF can act as survival signals for ECs. We therefore hypothesized that combined blockade would result in increased EC apoptosis. Quantification of apoptotic ECs was done using TUNEL (Figure 5C, red), PECAM-1 (Figure 5C, green), and nuclear DAPI immunostaining (Figure 5C, blue). A cell was considered an apoptotic EC when its nucleus, stained by DAPI, overlapped with TUNEL stain (red), and was surrounded by PECAM-1 (green) (Figure 5C, arrowheads). The number of apoptotic ECs in each section was then normalized to the PECAM positive area in each tumor. This quantification showed a significant increase in apoptotic EC in NGP-N1D + BV tumors (Figure 5D, P < 0.01). This increase in apoptotic ECs suggested that Notch and VEGF are both survival signals in tumor ECs, which act independently.
In order to test the effects of VEGF and Notch on EC survival
Inhibition of Notch signaling with γ-secretase inhibitors or anti-Dll4 antibodies have found that there is increased EC proliferation
Notch1 decoy and BV alter pericyte coverage of blood vessels
Immunostaining for the mature pericyte marker αSMA demonstrated discontinuity in this stromal cell envelope in NGP-N1D tumors as compared to NGP-LacZ, along with a more flattened morphology (Figure 6A, arrows), in agreement with our previous data [5]. BV treatment led to a thinner layer of pericytes, although immunostaining revealed a continuous pattern (Figure 6A, bottom left). Combined inhibition with N1D + BV, similar to N1D, led to discontinuity together with altered pericyte morphology (Figure 6A, right panels, white arrows). Quantification revealed an increase in total αSMA(+) area in NGP-N1D compared to the other groups (Figure 6B). NGP-N1D + BV had decreased αSMA(+) area compared to NGP-LacZ and NGP-N1D, indicating that combined blockade both diminishes the amount of pericytes coverage as well as disrupting the coverage (Figure 6B). Similar findings were seen using NG2, a marker of more immature pericytes (data not shown).
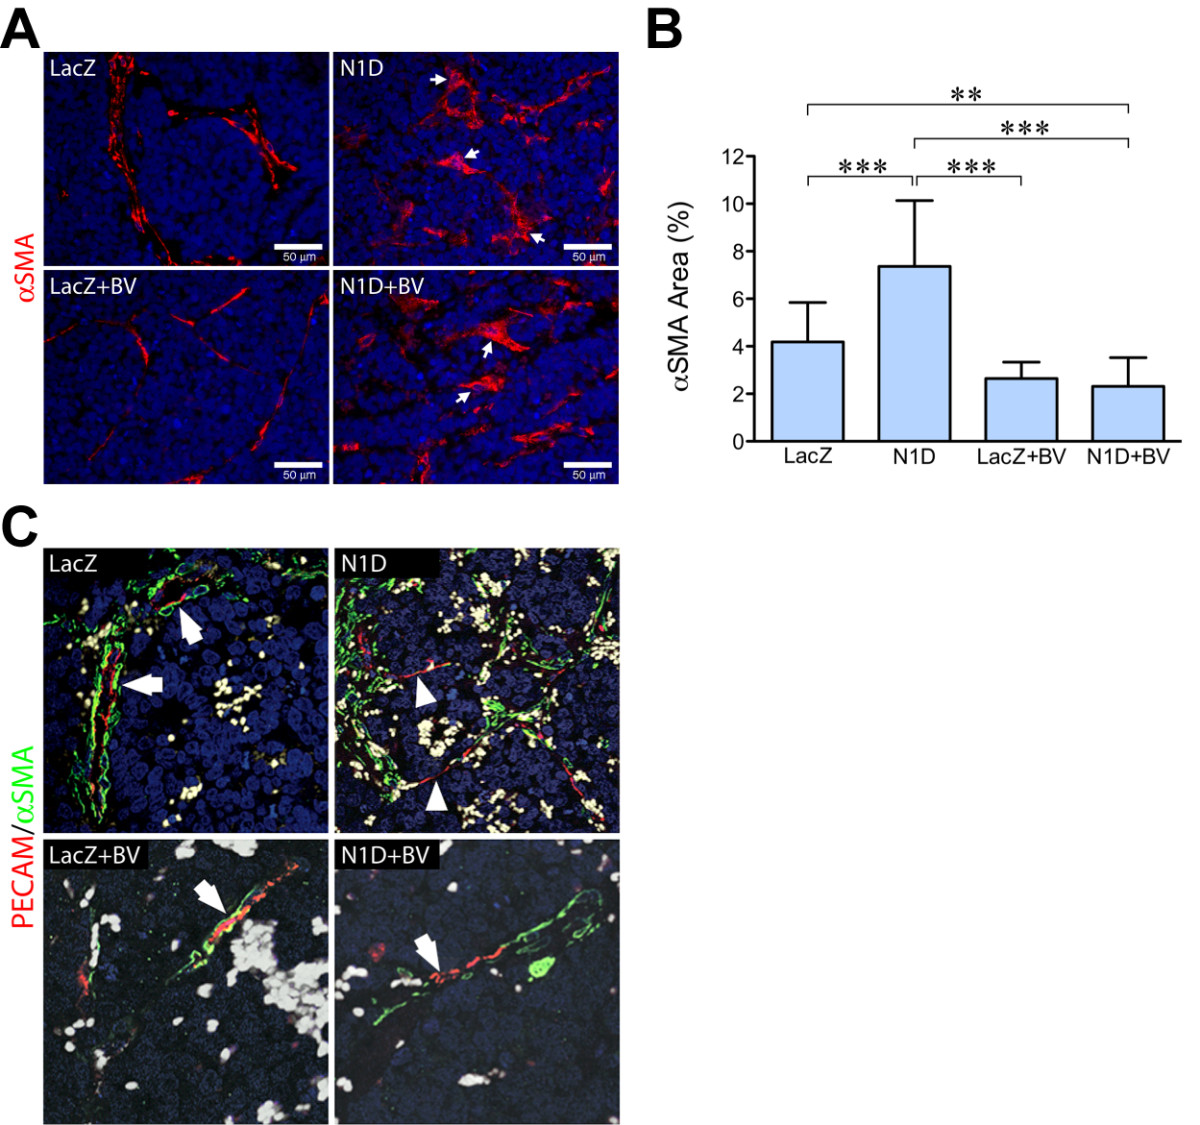
Figure 6
Figure 6 caption
Notch blockade disrupts pericyte interaction with endothelial cells. (A) Immunofluorescence for the mature pericyte marker αSMA (red). NGP-N1D pericytes are discontinuous and their morphology is altered (right top, white arrows), compared to controls (left top). NGP-LacZ + BV vasculature had continuous coverage of pericytes. Pericytes of NGP-N1D + BV tumors showed discontinuity and altered morphology (bottom right, arrows). RBCs autofluoresce green. Bar = 50 μm. (B) Quantification of αSMA showed significant increase in NGP-N1D tumors, with a decrease in NGP-LacZ + BV and NGP-N1D + BV. Error bars represent SD. **P < 0.01, ***P < 0.001. (C) Confocal analysis of immunostaining for PECAM-1 (red) and αSMA (green). NGP-LacZ control tumors demonstrated PECAM-1(+) cells surrounded by αSMA(+) pericytes (upper left, arrows), NGP-Notch1 decoy tumors had stretches of PECAM-1(+) cells without surrounding αSMA(+) pericytes (upper right, arrowheads). NGP-LacZ + BV tumors had PECAM-1(+) cells surrounded by thin layers of αSMA(+) pericytes (lower left, arrow), while NGP-N1D + BV tumors had PECAM-1(+) cells not surrounded by αSMA(+) pericytes (lower right, arrowhead). RBCs are pseudocolored grey.
Confocal imaging for endothelial marker PECAM-1 and αSMA revealed that, while NGP-LacZ control tumor EC had neighboring pericytes (arrows), NGP-N1D tumors developed segments of ECs that lacked pericyte coverage (Figure 6C, right panel, arrowheads). NGP-LacZ + BV tumors contained ECs still covered by pericytes, although the pericyte layer was thinned compared to controls (Figure 6C, lower left panel). Similar to the NGP-N1D tumor vessels, NGP-N1D + BV vessels displayed segmental defects in pericyte coverage (Figure 6C, lower right, white arrows).
Notch1 decoy effects on vasculature are direct
Immunofluorescence for cleaved Notch1 demonstrated Notch activation in vasculature of NGP-LacZ and NGP-LacZ + BV, but a paucity of activation in NGP-N1D and NGP-N1D + BV tumor vessels (Additional file 3). These data suggest that Notch blockade predominantly affects vascular cells. However, quantitative real time PCR analysis revealed that NGP tumor cells also express Notch1. In order to test the specificity of the effects of Notch blockade, we silenced Notch1 (shN1) in NGP.
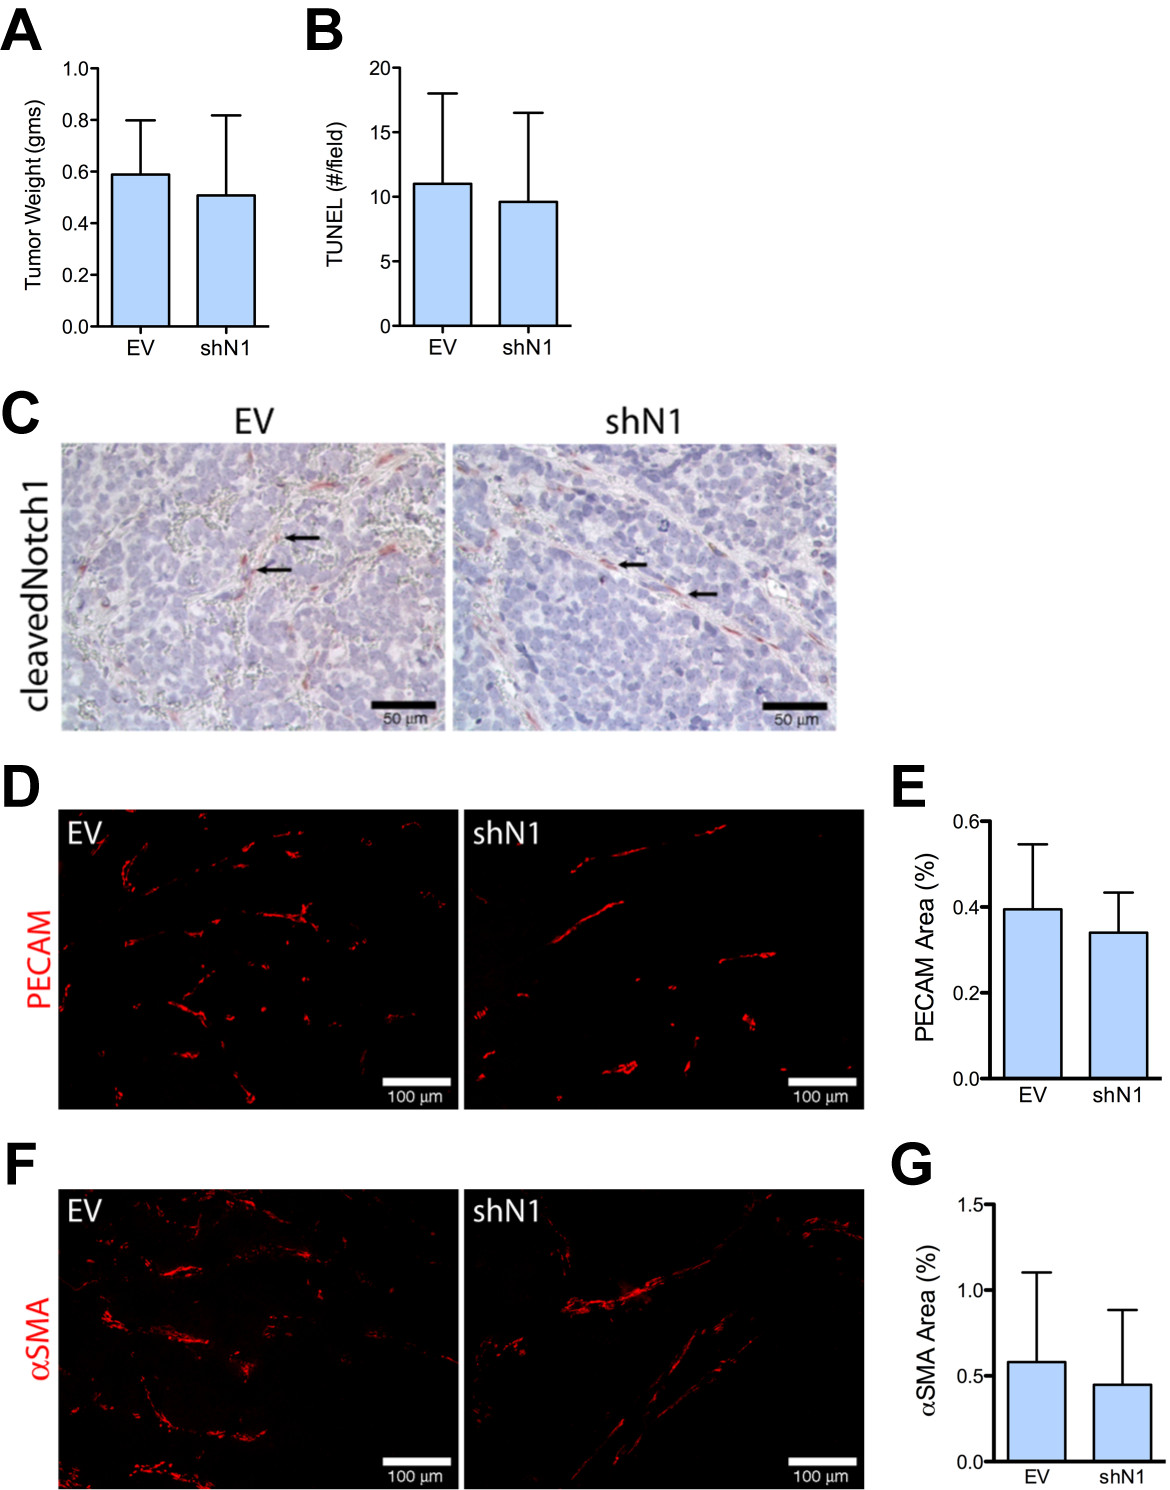
Figure 7
Figure 7 caption
Silencing of Notch1 does not recapitulate the vasculature seen with NGP-N1D. (A) NGP-EV and NGP-shN1 tumor weights were not different. Error bars represent SD. (B) The number of TUNEL positive cells is not different between the NGP-EV and NGP-shN1 tumors. (C) Cleaved Notch1 is present in vasculature of NGP-EV and NGP-shN1 (arrows). (D) The EC marker PECAM-1 does not show discontinuity or lack of coverage in vasculature of NGP-shN1 tumors. Bar = 100 μm. (E) The percentage of PECAM-1 coverage did not differ between NGP-EV and NGP-shN1 tumors. Error bars represent SD. P = n.s. (F) The pericyte marker αSMA does not show erratic, discontinuous immunostaining in NGP-shN1 tumors. Bar = 100 μm. (G) There was no difference in percentage of αSMA coverage between NGP-EV and NGP-shN1 tumors. Error bars represent SD. P = n.s.
Discussion
A growing body of literature demonstrates crosstalk between Notch and VEGF pathways in angiogenesis
Our data indicate that while VEGF blockade induces vascular cooption, this does not rescue tumors from hypoxia. Furthermore, while Notch blockade decreases cooption, this does not increase the VEGF-blockade induced hypoxia. This suggests that vascular cooption is relatively inefficient as a mechanism of providing oxygen to tumors; other potential contributions of co-opted vessels to tumor homeostasis remain unclear.
Our current results demonstrate that while Notch blockade can disrupt EC/pericyte interaction, it is only in the absence of VEGF that there is marked loss of vasculature, perfusion, and subsequent induction of tumor necrosis. In the context of loss of VEGF, Notch blockade causes EC apoptosis both
Other groups have shown that antibodies against Dll4 and Notch1 increase non-functional EC vasculature in subcutaneous tumor models [8, 14, 15]. Endothelial Jagged1, however, has been shown to decrease sprouting in the mouse retinal model [18]. Therefore, the ability of the N1D to block both signaling by both Dll4 and Jagged1 [5] may explain the observed decrease in EC in NGP-N1D tumors. Our studies also suggest that the effect of Notch blockade on tumor angiogenesis is context-dependent. Thus, this effect may vary with different tumor models, and perhaps with tumor types.
Conclusions
Our data lead us to propose that the Notch and VEGF pathways play distinct but complementary roles in tumor angiogenesis, and that Notch is required for VEGF-mediated vascular remodeling. Here we show that concurrent blockade disrupts primary tumor vasculature and viability further than inhibition of either pathway alone, and that manipulation of each pathway is reflected in distinct vascular defects. Further investigation of the interaction between VEGF and Notch signaling in vasculature may allow refinement of a combined approach to targeting tumor angiogenesis.
Additional files
Additional file 1: Figure S1: N1D is expressed in NGP-N1D and NGP-N1D + BV tumors. A) Immunostaining for human Fc indicates the presence of N1D in NGP-N1D tumors (right panel, red), but not in NGP-LacZ tumors (left panel). Bar = 200 μm B) SDS-Page shows the presence of N1D (upper band) in NGP-N1D + BV, but not in NGPLacZ + BV tumors. Presence of BV, which also contains Fc, is observed in both NGP-LacZ + BV and NGP-N1D + BV tumors (lower band). (PDF 617 KB)
Additional file 2: Figure S2: Cleaved Notch1 activity is decreased in N1D tumors. Immunostaining for cleaved Notch1 (red) demonstrates increased Notch1 activity in vasculature of NGP-LacZ and NGP-LacZ + BV tumors, but nearly absent Notch1 activity in NGP-N1D and NGP-N1D + BV tumors. For NGP-LacZ + BV, cleaved Notch1 is seen in vascular cells surrounding a coopted glomeruli (green fluorescence due to fluorescein-labeled lectin). RBCs autofluoresce green/yellow. Nuclei are stained with DAPI (blue). Bar = 50 μm. (PDF 2 MB)
Additional file 3: Genes up/down regulated in NGP-N1D+BV, NGP-N1D, NGP-LacZ+BV tumors.(XLSX 36 KB)
Acknowledgements
These studies were supported by the National Institutes of Health (1R01CA124644, to DJY), (3R01CA124644-03S1, to AKC), the Pediatric Cancer Foundation (to DJY and JJK), the Sorkin Fund (to JJK), and the Children’s Neuroblastoma Cancer Foundation (to SLH and DJY).
Authors’ original submitted files for images
Below are the links to the authors’ original submitted files for images.
Authors’ original file for figure 1
Authors’ original file for figure 2
Authors’ original file for figure 3
Authors’ original file for figure 4
Authors’ original file for figure 5
Authors’ original file for figure 6
Authors’ original file for figure 7
References
- Phase I trial and pharmacokinetic study of bevacizumab in pediatric patients with refractory solid tumors: a Children’s Oncology Group Study. J Clin Oncol. 2008;26:399-405.
- Potent VEGF blockade causes regression of coopted vessels in a model of neuroblastoma. Proc Natl Acad Sci USA. 2002;99:11399-11404.
- Vascular endothelial growth factor blockade rapidly elicits alternative proangiogenic pathways in neuroblastoma. Int J Oncol. 2009;34:401-407.
- Inhibition of vascular endothelial growth factor-induced angiogenesis suppresses tumour growth in vivo. Nature. 1993;362:841-844.
- A notch1 ectodomain construct inhibits endothelial notch signaling, tumor growth, and angiogenesis. Cancer Res. 2008;68:4727-4735.
- Gene set enrichment analysis: a knowledge-based approach for interpreting genome-wide expression profiles. Proc Natl Acad Sci USA. 2005;102:15545-15550.
- Abnormalities of basement membrane on blood vessels and endothelial sprouts in tumors. Am J Pathol. 2003;163:1801-1815.
- Inhibition of Dll4 signalling inhibits tumour growth by deregulating angiogenesis. Nature. 2006;444:1083-1087.
- Notch activation induces endothelial cell cycle arrest and participates in contact inhibition: role of p21Cip1 repression. Mol Cell Biol. 2004;24:8813-8822.
- Regulation of Notch1 and Dll4 by vascular endothelial growth factor in arterial endothelial cells: implications for modulating arteriogenesis and angiogenesis. Mol Cell Biol. 2003;23:14-25.
- Notch regulates the angiogenic response via induction of VEGFR-1. J Angiogenes Res. 2010;2:3-.
- Notch alters VEGF responsiveness in human and murine endothelial cells by direct regulation of VEGFR-3 expression. J Clin Invest. 2007;117:3369-3382.
- Notch activation during endothelial cell network formation in vitro targets the basic HLH transcription factor HESR-1 and downregulates VEGFR-2/KDR expression. Microvasc Res. 2002;64:372-383.
- Blockade of Dll4 inhibits tumour growth by promoting non-productive angiogenesis. Nature. 2006;444:1032-1037.
- Therapeutic antibody targeting of individual Notch receptors. Nature. 2010;464:1052-1057.
- Combination antiangiogenic therapy: increased efficacy in a murine model of Wilms tumor. Journal of pediatric surgery. 2001;36:1177-1181.
- Modes of resistance to anti-angiogenic therapy. Nature reviews Cancer. 2008;8:592-603.
- The notch ligands Dll4 and Jagged1 have opposing effects on angiogenesis. Cell. 2009;137:1124-1135.

